# OLE / POLE Labor Effectiveness Analysis
OEE tells you how well an **asset** performed, what fraction of its scheduled time it was actually running, at what rate, making good product. It doesn't tell you anything about the people running it.
OLE and POLE extend the standard OEE model with a **labor** dimension. They answer "how effective was the *operator*," not just "how effective was the *asset*."
OLE and POLE (Operator Labor Effectiveness / Productive OLE) are the same OEE math, but applied to **labor** instead of the machine.
They answer questions OEE structurally: Was anyone actually scheduled to be here? Did they show up? Were they present but the line wasn't running anyway? Is one specific operator or line dragging a whole site's numbers down?
Downtime and low output have two very different root causes that look identical on a plain OEE report: "the machine wasn't running" could mean a mechanical fault, or it could mean nobody was scheduled to run it, or someone was scheduled and didn't show up, or someone showed up but the line was down waiting on parts. OEE alone can't tell those apart. OLE/POLE closes that gap by bringing scheduling (who's supposed to be here) and login/logout activity (who's actually here) into the same picture as the asset's own run-state data.
- **Tell staffing problems apart from mechanical ones.** If attendance is low, the problem is scheduling/attendance, not the equipment. If attendance is fine but POLE is low, the operator was present and the line still wasn't producing - that's a real downtime problem, not a staffing one.
- **Catch understaffing early.** Attendance (and the "Labor Gap" KPI going negative/"Understaffed") drops the moment fewer people show up than were scheduled, even if the line is currently keeping up anyway - a leading indicator, not just a lagging one.
- **See "present but not producing" time.** The gap between OLE and POLE for the same person/period is literally the time they were logged in while the machine wasn't running - changeover, waiting on materials, unplanned downtime absorbed by labor rather than the asset.
- **Rank and compare operators fairly**, even when several people share one asset at once, via the leaderboard's attribution modes (even split, full credit for training/shadowing, or primary-operator-only credit).
- **Roll numbers up without re-scheduling anything.** Point the dashboard at an area or an entire site instead of one line, and the same numbers aggregate automatically across every line beneath it - schedules set at a site level (the normal case, since crews are scheduled at the site, not the line) resolve down to whichever line an operator actually logs into.
- **Drill from "who's underperforming" to "on which line."** Click any operator in the leaderboard to break their combined number down by the individual asset(s) they actually worked, so a bad site-wide number doesn't stay a mystery.
 ---
## Calculating OLE / POLE
OLE and POLE share the same Performance and Quality factors as OEE. They differ only in how **Availability** is defined:
| Metric | Availability numerator | Answers |
|---|---|---|
| **OLE** (Operator Labor Effectiveness) | `loggedInSecs` - raw presence | "Was the operator logged in, regardless of whether the asset was running?" |
| **POLE** (Productive OLE) | `productiveSecs` - logged in **and** the asset was actually running | "Was the operator present *and* was work actually happening?" |
```
oleAvailability = loggedInSecs / scheduledSecs
poleAvailability = productiveSecs / scheduledSecs
performance = rate achieved vs. standard rate, while productive
quality = yield after waste
ole = oleAvailability * performance * quality
pole = poleAvailability * performance * quality
```
The gap between `oleAvailability` and `poleAvailability` for the same operator/period is itself meaningful: it's time the operator was **present but the machine wasn't producing** - changeover, waiting on materials, unassigned downtime. This is exposed on the dashboard as the "Labor Gap" KPI tile.
At the **per-operator** level (`spGetOLEData`, `spGetOLEDataByInterval`, `spGetOLEDataByShift`, `spGetOLEOperatorLeaderboard`), `oleAvailability` and `poleAvailability` share the same `scheduledSecs` denominator, so `poleAvailability` can never exceed `oleAvailability` and Labor Gap is always ≥ 0.
At the **whole-asset** level (`spGetOLEDataAsset`, `spGetOLEDataAssetByInterval` - the dashboard's KPI tiles and trend chart), the two use **different** denominators (see those procs below), so Labor Gap can go **negative**. A negative value means the asset kept producing near its normal rate despite fewer scheduled labor-hours actually showing up - understaffed, but currently holding - a distinct signal from the positive case, and the dashboard's Labor Gap tile badges/labels the two differently ("Present, not producing" vs. "Understaffed").
:::info Crew attribution
When more than one operator is logged into the same asset at once, counter output (infeed/outfeed/waste) is split between them via **attribution mode**, so credit isn't double-counted:
- **EvenSplit** (default) - time-weighted share based on how many other operators were concurrently logged in.
- **FullCredit** - every concurrent operator gets full credit (e.g. training/shadowing).
- **PrimaryOnly** - only the first-logged-in operator at each moment gets performance/quality credit; others still get their own OLE/POLE availability from their own session.
:::
---
## Crews & Scheduling
Operators are scheduled onto assets one of two ways: individually (`addOperatorShiftAssignment`) or as an entire crew at once (`assignCrewToShift`, which snapshots whoever was an *active crew member as of the assignment's `startDate`* - not whoever's on the crew today). Both paths write to the same table, `sch.operatorShiftAssignment`, which is what every `scheduledSecs` figure above is ultimately computed from.
A crew (`sch.crew`) is a named group scoped to a **site**, not to individual assets below it. Membership (`sch.crewMember`) is time-bound (`startDate`/`endDate`, `endDate` nullable for an ongoing membership) rather than a fixed link, so an operator's crew history is preserved across moves between crews.
---
## How to use it
The feature has three moving pieces that all feed the same analysis: **scheduling** (optional, but needed for Attendance/Labor Gap to mean anything), **logging in/out** (what actually happened), and **the dashboard** (where you read it).
### 1. Schedule the labor (optional)
Set up who's supposed to be where, before the shift starts:
- Create a **crew** - a named group of operators tied to a site (not an individual line below it), via the Crews tab.
- Add operators to that crew with a start date (and an end date once they leave it) via the Crew Members tab - membership is time-bound, so an operator's crew history is preserved as people move between crews.
- On the Scheduling tab, either **assign the whole crew** to a shift at once (snapshotting whoever was an active member as of that shift's start), or assign **one operator individually** without going through a crew at all.
Skipping this step isn't a dead end - see "Unscheduled fallback" in the technical reference below for what happens to attendance numbers for someone who logs in without ever being scheduled.
### 2. Operators log in and out of the line they're working
This is the raw presence data everything else is built from. When an operator starts working a line, they log in to that specific asset; when they stop (break, shift end, moving to a different line), they log out. This is tracked independently of scheduling - an operator can legitimately show up on a line they weren't scheduled for, or be scheduled somewhere and never show up at all, and the analysis reflects both cases honestly rather than assuming one implies the other.
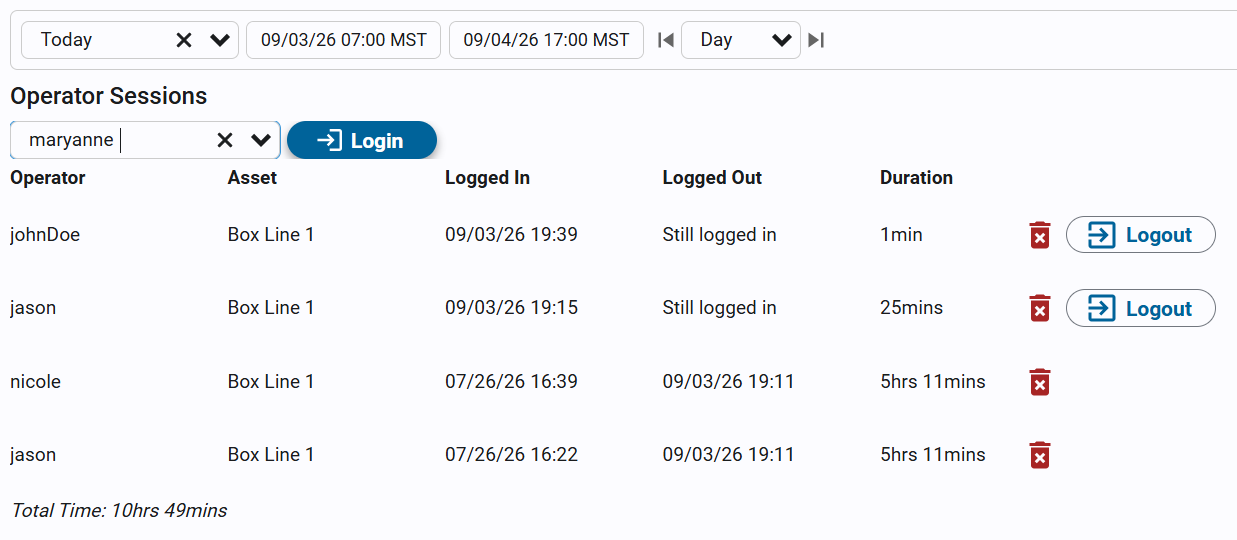
The Operator Login widget allows users to 'login' to an asset. Note, this is not logging into the application, more of an operator 'badging in' to a line.
Alternately, the kanoa/mes/operator/operatorLoginPanel view can be used for badging in.
---
## Calculating OLE / POLE
OLE and POLE share the same Performance and Quality factors as OEE. They differ only in how **Availability** is defined:
| Metric | Availability numerator | Answers |
|---|---|---|
| **OLE** (Operator Labor Effectiveness) | `loggedInSecs` - raw presence | "Was the operator logged in, regardless of whether the asset was running?" |
| **POLE** (Productive OLE) | `productiveSecs` - logged in **and** the asset was actually running | "Was the operator present *and* was work actually happening?" |
```
oleAvailability = loggedInSecs / scheduledSecs
poleAvailability = productiveSecs / scheduledSecs
performance = rate achieved vs. standard rate, while productive
quality = yield after waste
ole = oleAvailability * performance * quality
pole = poleAvailability * performance * quality
```
The gap between `oleAvailability` and `poleAvailability` for the same operator/period is itself meaningful: it's time the operator was **present but the machine wasn't producing** - changeover, waiting on materials, unassigned downtime. This is exposed on the dashboard as the "Labor Gap" KPI tile.
At the **per-operator** level (`spGetOLEData`, `spGetOLEDataByInterval`, `spGetOLEDataByShift`, `spGetOLEOperatorLeaderboard`), `oleAvailability` and `poleAvailability` share the same `scheduledSecs` denominator, so `poleAvailability` can never exceed `oleAvailability` and Labor Gap is always ≥ 0.
At the **whole-asset** level (`spGetOLEDataAsset`, `spGetOLEDataAssetByInterval` - the dashboard's KPI tiles and trend chart), the two use **different** denominators (see those procs below), so Labor Gap can go **negative**. A negative value means the asset kept producing near its normal rate despite fewer scheduled labor-hours actually showing up - understaffed, but currently holding - a distinct signal from the positive case, and the dashboard's Labor Gap tile badges/labels the two differently ("Present, not producing" vs. "Understaffed").
:::info Crew attribution
When more than one operator is logged into the same asset at once, counter output (infeed/outfeed/waste) is split between them via **attribution mode**, so credit isn't double-counted:
- **EvenSplit** (default) - time-weighted share based on how many other operators were concurrently logged in.
- **FullCredit** - every concurrent operator gets full credit (e.g. training/shadowing).
- **PrimaryOnly** - only the first-logged-in operator at each moment gets performance/quality credit; others still get their own OLE/POLE availability from their own session.
:::
---
## Crews & Scheduling
Operators are scheduled onto assets one of two ways: individually (`addOperatorShiftAssignment`) or as an entire crew at once (`assignCrewToShift`, which snapshots whoever was an *active crew member as of the assignment's `startDate`* - not whoever's on the crew today). Both paths write to the same table, `sch.operatorShiftAssignment`, which is what every `scheduledSecs` figure above is ultimately computed from.
A crew (`sch.crew`) is a named group scoped to a **site**, not to individual assets below it. Membership (`sch.crewMember`) is time-bound (`startDate`/`endDate`, `endDate` nullable for an ongoing membership) rather than a fixed link, so an operator's crew history is preserved across moves between crews.
---
## How to use it
The feature has three moving pieces that all feed the same analysis: **scheduling** (optional, but needed for Attendance/Labor Gap to mean anything), **logging in/out** (what actually happened), and **the dashboard** (where you read it).
### 1. Schedule the labor (optional)
Set up who's supposed to be where, before the shift starts:
- Create a **crew** - a named group of operators tied to a site (not an individual line below it), via the Crews tab.
- Add operators to that crew with a start date (and an end date once they leave it) via the Crew Members tab - membership is time-bound, so an operator's crew history is preserved as people move between crews.
- On the Scheduling tab, either **assign the whole crew** to a shift at once (snapshotting whoever was an active member as of that shift's start), or assign **one operator individually** without going through a crew at all.
Skipping this step isn't a dead end - see "Unscheduled fallback" in the technical reference below for what happens to attendance numbers for someone who logs in without ever being scheduled.
### 2. Operators log in and out of the line they're working
This is the raw presence data everything else is built from. When an operator starts working a line, they log in to that specific asset; when they stop (break, shift end, moving to a different line), they log out. This is tracked independently of scheduling - an operator can legitimately show up on a line they weren't scheduled for, or be scheduled somewhere and never show up at all, and the analysis reflects both cases honestly rather than assuming one implies the other.
The Operator Login widget allows users to 'login' to an asset. Note, this is not logging into the application, more of an operator 'badging in' to a line.
Alternately, the kanoa/mes/operator/operatorLoginPanel view can be used for badging in.
 ### 3. Open the dashboard and read the numbers
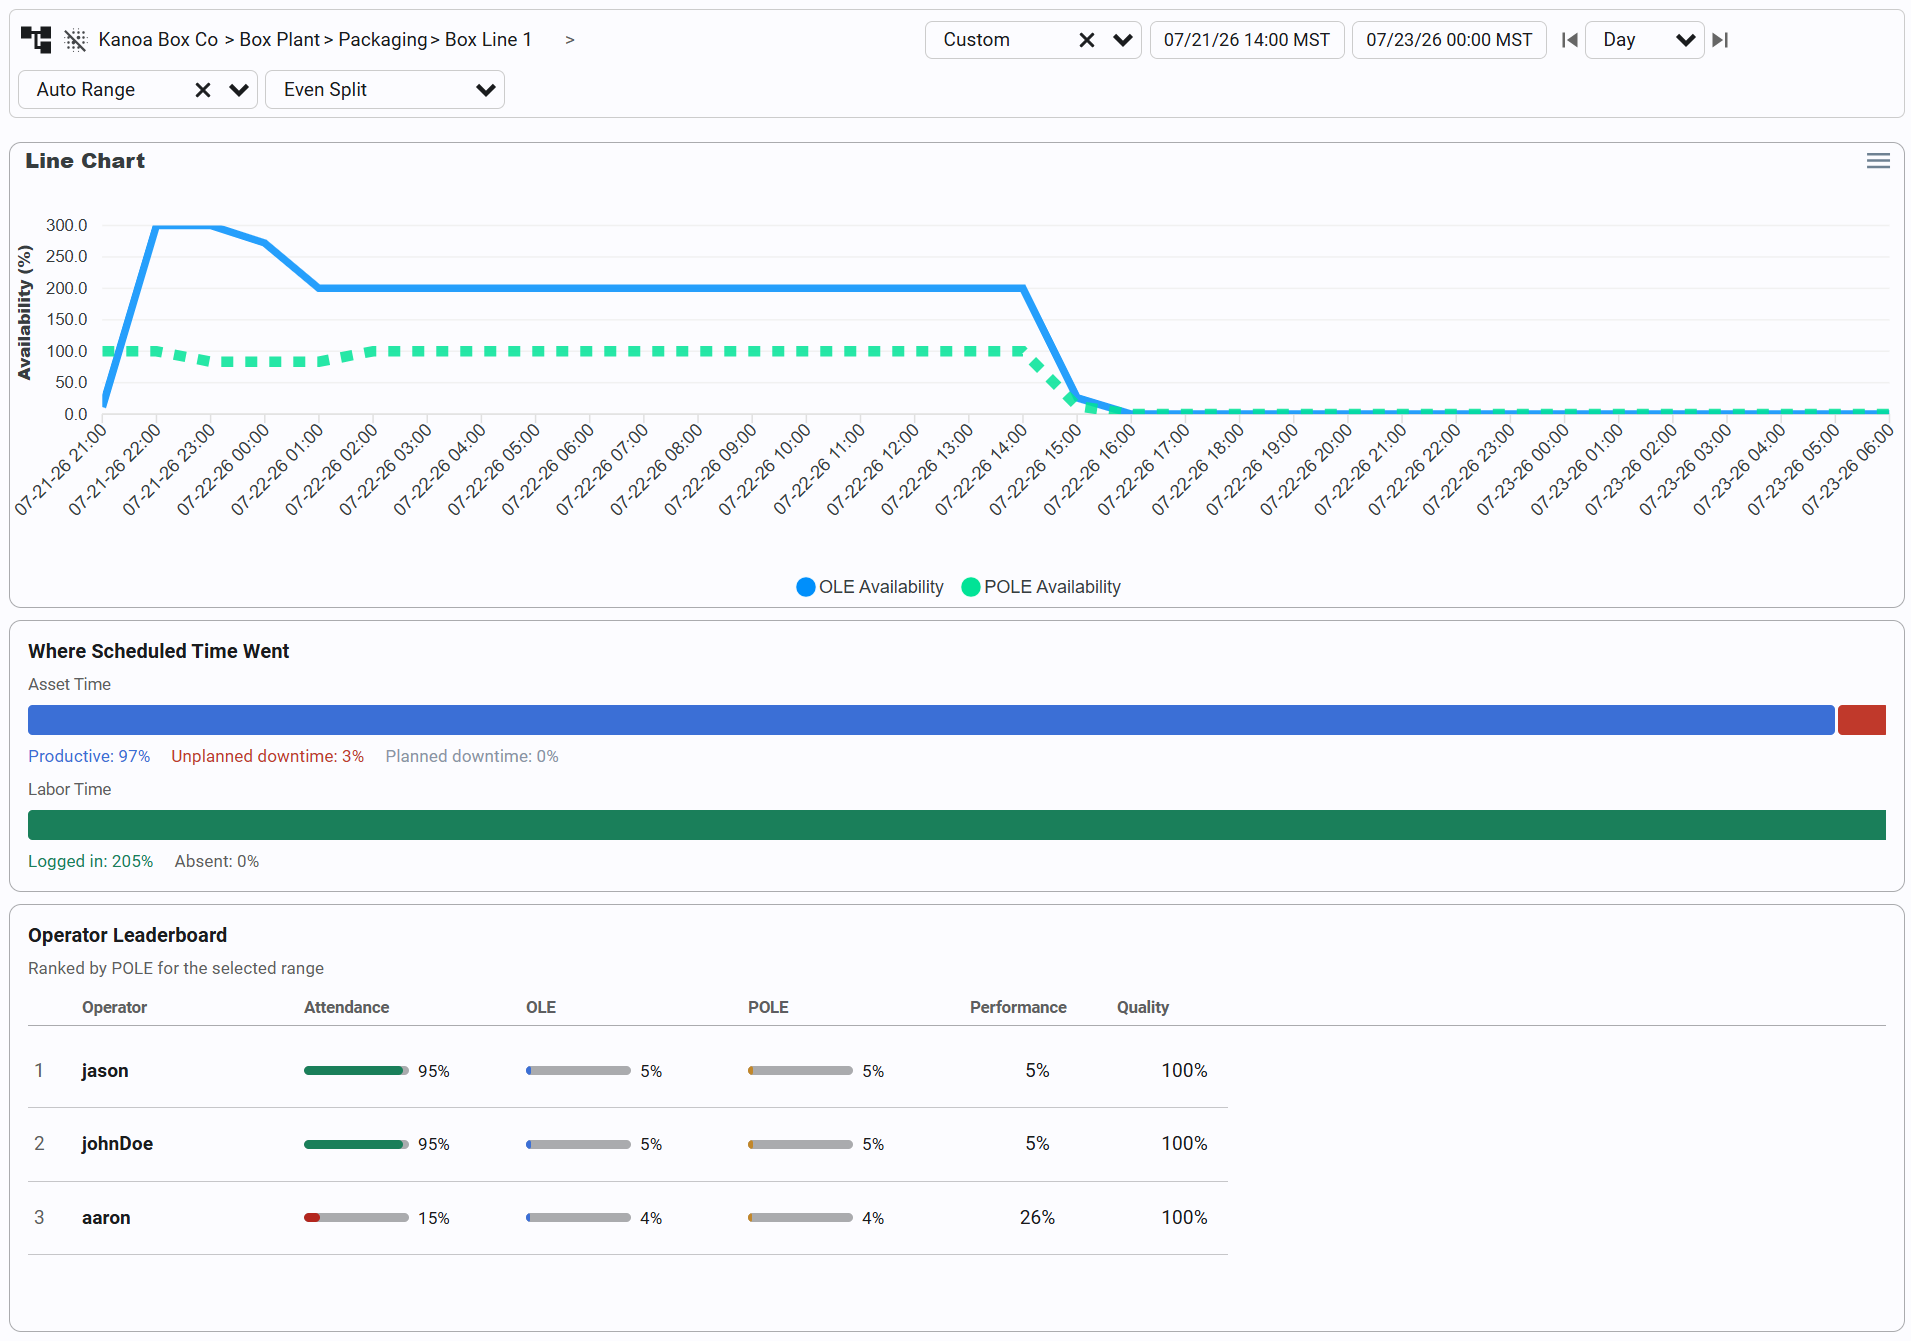
Pick an asset (a single line, or an entire area/site to see everything beneath it combined), a date range, and an attribution mode, and the dashboard shows:
- **KPI tiles** - Attendance, OLE, POLE, Performance, Quality, and Labor Gap for the whole selection. Hover any tile for a plain-language explanation of what it's measuring.
- **Trend chart** - OLE vs. POLE availability over time, bucketed by hour/day/week (or auto-sized to the range).
- **Utilization breakdown** - where scheduled time actually went, split into asset time (productive/downtime) and labor time (logged in/absent).
- **Operator leaderboard** - every operator active in the range, ranked by POLE.
### 4. Drill into an operator
Click any row in the leaderboard to see that operator's numbers broken down by the individual asset(s) they actually worked, instead of one combined figure for the whole site/area. Useful for turning "this operator's POLE is low" into "...specifically because of what happened on Box Line 1, not Case Packer."
---
## Technical Reference
Everything below is implementation detail - the actual SQL, Python, and Perspective pieces this feature is built from.
Both OLE and POLE share the same Performance and Quality factors as OEE. They differ only in how **Availability** is defined:
| Metric | Availability numerator | Answers |
|---|---|---|
| **OLE** (Operator Labor Effectiveness) | `loggedInSecs` - raw presence | "Was the operator logged in, regardless of whether the asset was running?" |
| **POLE** (Productive OLE) | `productiveSecs` - logged in **and** the asset was actually running | "Was the operator present *and* was work actually happening?" |
```
oleAvailability = loggedInSecs / scheduledSecs
poleAvailability = productiveSecs / scheduledSecs
performance = rate achieved vs. standard rate, while productive
quality = yield after waste
ole = oleAvailability * performance * quality
pole = poleAvailability * performance * quality
```
The gap between `oleAvailability` and `poleAvailability` for the same operator/period is itself meaningful: it's time the operator was **present but the machine wasn't producing** - changeover, waiting on materials, unassigned downtime. This is exposed on the dashboard as the "Labor Gap" KPI tile.
At the **per-operator** level (`spGetOLEData`, `spGetOLEDataByInterval`, `spGetOLEDataByShift`, `spGetOLEOperatorLeaderboard`, `spGetOLEOperatorAssetBreakdown`), `oleAvailability` and `poleAvailability` share the same `scheduledSecs` denominator, so `poleAvailability` can never exceed `oleAvailability` and Labor Gap is always ≥ 0.
At the **whole-asset** level (`spGetOLEDataAsset`, `spGetOLEDataAssetByInterval` - the dashboard's KPI tiles and trend chart), the two use **different** denominators (see those procs below), so Labor Gap can go **negative**. A negative value means the asset kept producing near its normal rate despite fewer scheduled labor-hours actually showing up - understaffed, but currently holding - a distinct signal from the positive case, and the dashboard's Labor Gap tile badges/labels the two differently ("Present, not producing" vs. "Understaffed").
:::info Crew attribution
When more than one operator is logged into the same asset at once, counter output (infeed/outfeed/waste) is split between them via **attribution mode**, so credit isn't double-counted:
- **EvenSplit** (default) - time-weighted share based on how many other operators were concurrently logged in.
- **FullCredit** - every concurrent operator gets full credit (e.g. training/shadowing).
- **PrimaryOnly** - only the first-logged-in operator at each moment gets performance/quality credit; others still get their own OLE/POLE availability from their own session.
:::
### Data Model Dependencies
| Table/View | Role |
|---|---|
| `mes.operatorAssetSession` | Login/logout events - the source of `loggedInSecs` |
| `sch.operatorShiftAssignment` | The labor roster - source of `scheduledSecs`. Self-contained `startDate`/`endDate` (`endDate` nullable for an open-ended assignment), captured once at creation and never re-derived from `sch.shiftBlock`/`sch.shiftEvent` at query time, so analytics stay decoupled from however shift generation is implemented. Optionally tied to a `sch.shift` (`shiftId`) and/or the `sch.crew` (`crewId`, provenance only) that generated it |
| `sch.crew` / `sch.crewMember` | Named, site-scoped operator groups with time-bound membership - the source of the operators `assignCrewToShift` inserts rows for |
| `sch.shift` / `sch.shiftName` | Pre-existing shift definitions (a `shiftName` like "AM Shift" resolved against a specific site/asset). `operatorShiftAssignment.shiftId` optionally references these for reporting/context; not created or managed by this feature |
| `mes.stateEvent` / `mes.state` / `mes.stateType` | Asset run-state history - the source of `productiveSecs` (via the `Running` state type) |
| `mes.counter` / `mes.counterEvent` | Infeed/outfeed/waste counts |
| `mes.itemAssetRate` | Standard/schedule rate configuration, one row per `(itemId, assetId)` |
| `mes.itemPeriod` | Lookup for the rate's period basis (e.g. `Hour`, `Batch (in mins)`) |
| `mes.vwAssetItem` | Joins `itemAssetRate` through to `itemPeriod` with clearer enabled-flag names |
| `mes.modeEvent` | Records which `itemId` was running on an asset over time; can also carry a `standardRate` **override** |
:::info Asset hierarchy
Crews (and therefore the shift assignments they generate) are scoped to a **site**-level asset, while operators actually log into and are analyzed at the **line** level below it. Every OLE/POLE proc resolves this by matching `operatorShiftAssignment.assetId` against the entire descendant hierarchy of the queried `@assetId` (via `mes.vwAsset.assetPath` prefix matching), not exact equality - a schedule set at "Kanoa Box Co\Box Plant" correctly applies to every line beneath it, e.g. "Kanoa Box Co\Box Plant\Packaging\Box Line 1". The whole-asset procs (`spGetOLEDataAsset`, `spGetOLEDataAssetByInterval`, `spGetOLEOperatorLeaderboard`, `spGetOLEOperatorAssetBreakdown`) additionally resolve every **descendant** of the queried asset when it's a site/area rather than a single line, so production data aggregates (or breaks down) across every line beneath it, filtered to `oeeEnabled = 1` assets only. Each proc resolves these sets once per call into temporary tables rather than re-checking per row.
:::
:::info Overlap prevention
`trg_operatorShiftAssignment_noOverlap` blocks a duplicate/overlapping assignment for the same operator to the **same shift or the same asset** - whether the row came from `assignCrewToShift` or `addOperatorShiftAssignment` doesn't matter, both write to the same table. It deliberately does **not** block the same operator across two *different* assets or shifts - a floater legitimately working two lines at once, or two non-overlapping shifts like Day/Night that happen to share an asset, are both allowed. `trg_crewMember_noOverlap` similarly blocks a duplicate/overlapping crew membership for the same crew+operator pair.
:::
:::warning Standard rate resolution
`standardRate` is **not** read directly off `itemAssetRate`. It's resolved via `mes.fnGetStandardRateAndPeriod`, which finds the most recent `modeEvent` for the asset (which carries the currently-running `itemId`), joins that to `itemAssetRate` for the baseline rate, and lets `modeEvent.standardRate` **override** it when explicitly set. If this resolves to `NULL` (no `modeEvent` row for the asset), `performance` - and therefore `ole`/`pole` - will correctly come back as `0`, not an error.
:::
:::warning No date range extends into the future
Every OLE/POLE proc clamps both `@startDate` and `@endDate` to `GETDATE()` if either is set later than "now" - mirroring the existing convention in `mes.fnGetRunTimesAndCounts`. Time that hasn't happened yet is never counted as scheduled/attendable time.
:::
#### Table Functions
```sql
mes.fnGetOperatorSessionSeconds(@userId INT, @assetId INT, @rangeStart DATETIME, @rangeEnd DATETIME) RETURNS INT
```
Total seconds this user was logged into `@assetId` (or any asset, if `@assetId` is `NULL`) within the range. The OLE availability numerator - raw presence, independent of whether the asset was running.
```sql
mes.fnGetOperatorProductiveSeconds(@userId INT, @assetId INT, @rangeStart DATETIME, @rangeEnd DATETIME, @runStateTypeId INT) RETURNS INT
```
Seconds where this user was **both** logged into `@assetId` **and** the asset's state type was `@runStateTypeId` (normally `Running`). The POLE availability numerator.
```sql
mes.fnGetOperatorAttributionShare(@userId INT, @assetId INT, @rangeStart DATETIME, @rangeEnd DATETIME, @attributionMode VARCHAR(20)) RETURNS FLOAT
```
Time-weighted share (0-1) of `@assetId`'s counter output attributable to `@userId` over the range, given how many other users were concurrently logged into the same asset. See `@attributionMode` values above.
```sql
mes.fnGetStandardRateAndPeriod(@assetId INT, @asOf DATETIME)
RETURNS TABLE (standardRate FLOAT, period VARCHAR(25))
```
Resolves the standard rate and its period basis for an asset as of a point in time: finds the asset's most recent `modeEvent` at/before `@asOf`, joins to `mes.vwAssetItem` on `(assetId, itemId)` for the baseline `standardRate`/`itemPeriodName`, and lets the `modeEvent`'s own `standardRate` override the baseline when set.
```sql
mes.fnGetOLEMetrics(@scheduledSecs INT, @loggedInSecs INT, @productiveSecs INT, @infeedCount FLOAT, @outfeedCount FLOAT, @wasteCount FLOAT, @packageCount FLOAT, @standardRate FLOAT, @period VARCHAR(50)) RETURNS TABLE
```
Mirrors `mes.fnGetOEEMetrics`'s shape - the shared function every OLE/POLE proc calls to turn raw seconds/counts into `oleAvailability`, `poleAvailability`, `performance`, and `quality`. Callers multiply these together for the final `ole`/`pole` scores. `spGetOLEDataAsset`/`spGetOLEDataAssetByInterval` only take `performance`/`quality` from this function's output - they compute their own `oleAvailability`/`poleAvailability` directly, since those two need different `scheduledSecs` denominators (see below).
---
#### Stored Procedures
```sql
mes.spGetOLEData(@userId INT, @assetId INT, @startDate DATETIME, @endDate DATETIME, @attributionMode VARCHAR(20))
```
Single-range OLE/POLE for one operator on one asset - or every operator in the "crew" (scheduled **or** logged into the asset during the range) when `@userId` is `NULL`.
`@attributionMode` defaults to `'EvenSplit'` if `NULL`.
Setting `@userId` to `NULL` returns one row per crew operator.
```sql
mes.spGetOLEDataByInterval(@userId INT, @assetId INT, @startDate DATETIME, @endDate DATETIME, @interval VARCHAR(10), @attributionMode VARCHAR(20))
```
Hour/Day/Week bucketed version of `spGetOLEData`. Adds `@interval VARCHAR(10)` (`'Hour'` / `'Day'` / `'Week'` / `NULL` for auto-sized buckets based on range length). Note: `@interval` controls **bucketing granularity** only - it is *not* the same thing as the rate's `@period` basis (which still comes from `fnGetStandardRateAndPeriod` per-bucket).
```sql
mes.spGetOLEDataByShift(@userId INT, @assetId INT, @startDate DATETIME, @endDate DATETIME, @attributionMode VARCHAR(20))
```
One row per `sch.operatorShiftAssignment` overlapping the range - a rostered shift instance is already a natural bucket. Each row also carries the assignment's `shiftId` (the `sch.shift` it's tied to, if any) for reference. Adds `@assetId INT = NULL`; required when `@userId` is `NULL` (there's no "every user's every shift" mode). Unlike the other procs, there's no login-session union here - a shift bucket only exists where there's a schedule row, so an off-schedule login has no shift-shaped bucket to appear under.
```sql
mes.spGetOLEDataAsset(@assetId INT, @startDate DATETIME, @endDate DATETIME)
```
Single-range, **whole-crew-combined** OLE/POLE for one asset, or aggregated across every `oeeEnabled` descendant asset when `@assetId` is a site/area. `productiveSecs`/counts come from `mes.fnGetRunTimesAndCounts` (summed per descendant asset); `loggedInSecs` is the sum of all login time across the related asset set.
`oleAvailability` and `poleAvailability` deliberately use **different** denominators here:
- `oleAvailability = loggedInSecs / laborScheduledSecs`, where `laborScheduledSecs` is the sum of every operator's scheduled seconds against this asset or any of its hierarchy ancestors/descendants - it scales with crew size, so it correctly drops below 100% when someone scheduled doesn't show up.
- `poleAvailability = productiveSecs / assetScheduledSecs`, where `assetScheduledSecs` is just the requested range's flat wall-clock duration - unaffected by crew size, since the asset either ran or it didn't regardless of how many people were assigned to it.
`standardRate`/`period` use `MAX()` across descendant assets as an approximation when more than one asset is involved. Backs the dashboard's KPI scorecard tiles.
```sql
mes.spGetOLEDataAssetByInterval(@assetId INT, @startDate DATETIME, @endDate DATETIME, @interval VARCHAR(10))
```
Bucketed version of `spGetOLEDataAsset`, with the same labor-vs-asset `scheduledSecs` split and descendant-asset aggregation applied per-bucket. Backs the dashboard's trend chart.
```sql
mes.spGetOLEOperatorLeaderboard(@assetId INT, @startDate DATETIME, @endDate DATETIME, @attributionMode VARCHAR(20))
```
One row per operator, ranked by POLE descending, aggregated across all of that operator's own shifts (safe to sum - same person, non-overlapping shifts, per `trg_operatorShiftAssignment_noOverlap`) **and** across every descendant asset when `@assetId` is a site/area - an operator who worked two lines under the same site shows up as one combined row instead of missing entirely or being split.
```sql
mes.spGetOLEOperatorAssetBreakdown(@userId INT, @assetId INT, @startDate DATETIME, @endDate DATETIME, @attributionMode VARCHAR(20))
```
The leaderboard's shape pivoted: one row per `oeeEnabled` descendant asset for a single operator, instead of one row per operator for a single asset. Powers the leaderboard's click-through drill-down - turns "this operator's combined POLE is low" into "specifically because of what happened on this one line."
:::tip Unscheduled fallback
Operators with **zero** shift assignments for the asset/range but who did log into it get a single fallback bucket spanning the entire requested range, instead of being silently excluded. A user with *any* real shift assignment is not blended with this fallback - their login time outside scheduled buckets simply isn't counted, to avoid double-counting.
This means "Attendance %" means different things depending on the row: for scheduled operators it's "% of your assigned shift you were logged in"; for unscheduled operators it's "% of the entire requested window you were logged in" - a legitimate but broader question. Low attendance numbers for someone who only recently logged in during a multi-day analysis window are expected, not a bug.
:::
### Python scripting API
All wrappers live under `system.kanoa.operators` (analytics functions are called in Perspective as `_kanoa_.operators.*`).
#### OLE / POLE analytics
```python
def getOLEData(userId, assetId, startDate, endDate, attributionMode)
def getOLEDataByInterval(userId, assetId, startDate, endDate, interval, attributionMode)
def getOLEDataByShift(userId, startDate, endDate, assetId, attributionMode)
def getOLEDataAsset(assetId, startDate, endDate)
def getOLEDataAssetByInterval(assetId, startDate, endDate, interval)
def getOLEOperatorLeaderboard(assetId, startDate, endDate, attributionMode)
def getOLEOperatorAssetBreakdown(userId, assetId, startDate, endDate, attributionMode)
```
#### Crews & shift assignments
```python
def addCrew(crewInfo, userId)
def updateCrew(crewInfo, userId)
def deleteCrew(crewId, userId)
def getCrews(paramsDict)
def addCrewMember(crewMemberInfo, userId)
def removeCrewMember(crewId, memberUserId, endDate, userId)
def getCrewMembers(paramsDict)
def assignCrewToShift(crewAssignmentInfo, userId)
def addOperatorShiftAssignment(assignmentInfo, userId)
def endOperatorShiftAssignment(operatorShiftAssignmentId, endDate, userId)
def deleteOperatorShiftAssignment(operatorShiftAssignmentId, userId)
def getOperatorShiftAssignments(paramsDict)
```
---
### Perspective Components
All under `kanoa/mes/operator/`.
#### Analytics dashboard
Composed into the `kanoa/core/dbp/screens/analytics/oleAnalysisDashboard` screen.
| View | Role |
|---|---|
| `oleAnalysisDashboard` | Screen shell - asset/date/interval/attribution-mode selectors, composes the widgets below, and swaps between the leaderboard and the operator breakdown panel |
| `oleKpiTile` | One reusable scorecard tile (label/value/sub/badge), repeated 6× for Attendance, OLE, POLE, Performance, Quality, and Labor Gap. Hovering a tile shows a description of what it measures |
| `oleTrendChart` | OLE vs. POLE availability over time, via `embr.chart.apex-charts`, timestamp-labeled per the selected interval |
| `oleUtilizationBreakdown` | Two stacked bars: **Asset Time** (Productive / Unplanned / Planned downtime, from `fnGetRunTimesAndCounts`) and **Labor Time** (Logged In / Absent) - kept as two independent bars because `productiveSecs` (asset runtime) and `loggedInSecs` (labor presence) are independent numbers and don't sum to one meaningful total |
| `oleOperatorLeaderboard` | Header + a repeated `oleLeaderboardRow` per operator, ranked by POLE. Clicking a row selects that operator and swaps in `oleOperatorBreakdown` |
| `oleLeaderboardRow` | One leaderboard row: rank, name, Attendance/OLE/POLE as color-coded progress bars, plain Performance/Quality percentages. Sends a page-scoped `operatorSelected` message on click |
| `oleOperatorBreakdown` | Per-asset breakdown table for one selected operator (via `getOLEOperatorAssetBreakdown`), with a Close button that sends `operatorDeselected` to return to the leaderboard |
#### Crew management
Composed into `crewManagementDashboard`, a tabbed shell.
| View | Role |
|---|---|
| `crewManagementDashboard` | Screen shell - tab container hosting the three views below |
| `crewsTab` | CRUD grid for `sch.crew` |
| `crewMembersTab` | Crew selector + membership grid for `sch.crewMember` - add/remove members |
| `schedulingTab` | Assign a crew or an individual operator to a shift (`assignCrewToShift` / `addOperatorShiftAssignment`), and view/end/delete existing assignments |
---
## Known limitations
- **Standard rate must be configured.** If `mes.modeEvent` has no row for an asset, `standardRate` resolves to `NULL`, forcing `performance` (and therefore `ole`/`pole`) to `0` even when availability is good. This is correct behavior, not a bug - it surfaces a missing rate configuration rather than fabricating a number.
- **Scheduling is optional per asset.** Assets/operators with no `sch.operatorShiftAssignment` data fall back to session-derived attendance (see "Unscheduled fallback" above) rather than returning empty results.
- **Overlapping session data will double-count.** `fnGetOperatorSessionSeconds` sums every qualifying session row without merging overlapping intervals - two overlapping (rather than sequential) login records for the same user/asset will inflate `loggedInSecs` past the wall-clock window. This is a data-quality assumption (session records shouldn't overlap), not something the function defends against.
- **`laborScheduledSecs` has the same non-dedup assumption.** It sums every scheduled operator's overlapping seconds without merging - `trg_operatorShiftAssignment_noOverlap` prevents the same operator having two overlapping assignments to the *same* shift or asset, but two operators legitimately assigned to the same asset at the same time (a multi-person crew) are correctly summed, by design.
- **Descendant-asset aggregation calls per-asset functions in a loop.** The whole-asset and leaderboard procs call `fnGetRunTimesAndCounts`/session/productivity functions once per descendant asset (and, for the leaderboard, once per bucket-row too). Fine for a handful of lines per site; worth revisiting if that number grows large.
### 3. Open the dashboard and read the numbers
Pick an asset (a single line, or an entire area/site to see everything beneath it combined), a date range, and an attribution mode, and the dashboard shows:
- **KPI tiles** - Attendance, OLE, POLE, Performance, Quality, and Labor Gap for the whole selection. Hover any tile for a plain-language explanation of what it's measuring.
- **Trend chart** - OLE vs. POLE availability over time, bucketed by hour/day/week (or auto-sized to the range).
- **Utilization breakdown** - where scheduled time actually went, split into asset time (productive/downtime) and labor time (logged in/absent).
- **Operator leaderboard** - every operator active in the range, ranked by POLE.
### 4. Drill into an operator
Click any row in the leaderboard to see that operator's numbers broken down by the individual asset(s) they actually worked, instead of one combined figure for the whole site/area. Useful for turning "this operator's POLE is low" into "...specifically because of what happened on Box Line 1, not Case Packer."
---
## Technical Reference
Everything below is implementation detail - the actual SQL, Python, and Perspective pieces this feature is built from.
Both OLE and POLE share the same Performance and Quality factors as OEE. They differ only in how **Availability** is defined:
| Metric | Availability numerator | Answers |
|---|---|---|
| **OLE** (Operator Labor Effectiveness) | `loggedInSecs` - raw presence | "Was the operator logged in, regardless of whether the asset was running?" |
| **POLE** (Productive OLE) | `productiveSecs` - logged in **and** the asset was actually running | "Was the operator present *and* was work actually happening?" |
```
oleAvailability = loggedInSecs / scheduledSecs
poleAvailability = productiveSecs / scheduledSecs
performance = rate achieved vs. standard rate, while productive
quality = yield after waste
ole = oleAvailability * performance * quality
pole = poleAvailability * performance * quality
```
The gap between `oleAvailability` and `poleAvailability` for the same operator/period is itself meaningful: it's time the operator was **present but the machine wasn't producing** - changeover, waiting on materials, unassigned downtime. This is exposed on the dashboard as the "Labor Gap" KPI tile.
At the **per-operator** level (`spGetOLEData`, `spGetOLEDataByInterval`, `spGetOLEDataByShift`, `spGetOLEOperatorLeaderboard`, `spGetOLEOperatorAssetBreakdown`), `oleAvailability` and `poleAvailability` share the same `scheduledSecs` denominator, so `poleAvailability` can never exceed `oleAvailability` and Labor Gap is always ≥ 0.
At the **whole-asset** level (`spGetOLEDataAsset`, `spGetOLEDataAssetByInterval` - the dashboard's KPI tiles and trend chart), the two use **different** denominators (see those procs below), so Labor Gap can go **negative**. A negative value means the asset kept producing near its normal rate despite fewer scheduled labor-hours actually showing up - understaffed, but currently holding - a distinct signal from the positive case, and the dashboard's Labor Gap tile badges/labels the two differently ("Present, not producing" vs. "Understaffed").
:::info Crew attribution
When more than one operator is logged into the same asset at once, counter output (infeed/outfeed/waste) is split between them via **attribution mode**, so credit isn't double-counted:
- **EvenSplit** (default) - time-weighted share based on how many other operators were concurrently logged in.
- **FullCredit** - every concurrent operator gets full credit (e.g. training/shadowing).
- **PrimaryOnly** - only the first-logged-in operator at each moment gets performance/quality credit; others still get their own OLE/POLE availability from their own session.
:::
### Data Model Dependencies
| Table/View | Role |
|---|---|
| `mes.operatorAssetSession` | Login/logout events - the source of `loggedInSecs` |
| `sch.operatorShiftAssignment` | The labor roster - source of `scheduledSecs`. Self-contained `startDate`/`endDate` (`endDate` nullable for an open-ended assignment), captured once at creation and never re-derived from `sch.shiftBlock`/`sch.shiftEvent` at query time, so analytics stay decoupled from however shift generation is implemented. Optionally tied to a `sch.shift` (`shiftId`) and/or the `sch.crew` (`crewId`, provenance only) that generated it |
| `sch.crew` / `sch.crewMember` | Named, site-scoped operator groups with time-bound membership - the source of the operators `assignCrewToShift` inserts rows for |
| `sch.shift` / `sch.shiftName` | Pre-existing shift definitions (a `shiftName` like "AM Shift" resolved against a specific site/asset). `operatorShiftAssignment.shiftId` optionally references these for reporting/context; not created or managed by this feature |
| `mes.stateEvent` / `mes.state` / `mes.stateType` | Asset run-state history - the source of `productiveSecs` (via the `Running` state type) |
| `mes.counter` / `mes.counterEvent` | Infeed/outfeed/waste counts |
| `mes.itemAssetRate` | Standard/schedule rate configuration, one row per `(itemId, assetId)` |
| `mes.itemPeriod` | Lookup for the rate's period basis (e.g. `Hour`, `Batch (in mins)`) |
| `mes.vwAssetItem` | Joins `itemAssetRate` through to `itemPeriod` with clearer enabled-flag names |
| `mes.modeEvent` | Records which `itemId` was running on an asset over time; can also carry a `standardRate` **override** |
:::info Asset hierarchy
Crews (and therefore the shift assignments they generate) are scoped to a **site**-level asset, while operators actually log into and are analyzed at the **line** level below it. Every OLE/POLE proc resolves this by matching `operatorShiftAssignment.assetId` against the entire descendant hierarchy of the queried `@assetId` (via `mes.vwAsset.assetPath` prefix matching), not exact equality - a schedule set at "Kanoa Box Co\Box Plant" correctly applies to every line beneath it, e.g. "Kanoa Box Co\Box Plant\Packaging\Box Line 1". The whole-asset procs (`spGetOLEDataAsset`, `spGetOLEDataAssetByInterval`, `spGetOLEOperatorLeaderboard`, `spGetOLEOperatorAssetBreakdown`) additionally resolve every **descendant** of the queried asset when it's a site/area rather than a single line, so production data aggregates (or breaks down) across every line beneath it, filtered to `oeeEnabled = 1` assets only. Each proc resolves these sets once per call into temporary tables rather than re-checking per row.
:::
:::info Overlap prevention
`trg_operatorShiftAssignment_noOverlap` blocks a duplicate/overlapping assignment for the same operator to the **same shift or the same asset** - whether the row came from `assignCrewToShift` or `addOperatorShiftAssignment` doesn't matter, both write to the same table. It deliberately does **not** block the same operator across two *different* assets or shifts - a floater legitimately working two lines at once, or two non-overlapping shifts like Day/Night that happen to share an asset, are both allowed. `trg_crewMember_noOverlap` similarly blocks a duplicate/overlapping crew membership for the same crew+operator pair.
:::
:::warning Standard rate resolution
`standardRate` is **not** read directly off `itemAssetRate`. It's resolved via `mes.fnGetStandardRateAndPeriod`, which finds the most recent `modeEvent` for the asset (which carries the currently-running `itemId`), joins that to `itemAssetRate` for the baseline rate, and lets `modeEvent.standardRate` **override** it when explicitly set. If this resolves to `NULL` (no `modeEvent` row for the asset), `performance` - and therefore `ole`/`pole` - will correctly come back as `0`, not an error.
:::
:::warning No date range extends into the future
Every OLE/POLE proc clamps both `@startDate` and `@endDate` to `GETDATE()` if either is set later than "now" - mirroring the existing convention in `mes.fnGetRunTimesAndCounts`. Time that hasn't happened yet is never counted as scheduled/attendable time.
:::
#### Table Functions
```sql
mes.fnGetOperatorSessionSeconds(@userId INT, @assetId INT, @rangeStart DATETIME, @rangeEnd DATETIME) RETURNS INT
```
Total seconds this user was logged into `@assetId` (or any asset, if `@assetId` is `NULL`) within the range. The OLE availability numerator - raw presence, independent of whether the asset was running.
```sql
mes.fnGetOperatorProductiveSeconds(@userId INT, @assetId INT, @rangeStart DATETIME, @rangeEnd DATETIME, @runStateTypeId INT) RETURNS INT
```
Seconds where this user was **both** logged into `@assetId` **and** the asset's state type was `@runStateTypeId` (normally `Running`). The POLE availability numerator.
```sql
mes.fnGetOperatorAttributionShare(@userId INT, @assetId INT, @rangeStart DATETIME, @rangeEnd DATETIME, @attributionMode VARCHAR(20)) RETURNS FLOAT
```
Time-weighted share (0-1) of `@assetId`'s counter output attributable to `@userId` over the range, given how many other users were concurrently logged into the same asset. See `@attributionMode` values above.
```sql
mes.fnGetStandardRateAndPeriod(@assetId INT, @asOf DATETIME)
RETURNS TABLE (standardRate FLOAT, period VARCHAR(25))
```
Resolves the standard rate and its period basis for an asset as of a point in time: finds the asset's most recent `modeEvent` at/before `@asOf`, joins to `mes.vwAssetItem` on `(assetId, itemId)` for the baseline `standardRate`/`itemPeriodName`, and lets the `modeEvent`'s own `standardRate` override the baseline when set.
```sql
mes.fnGetOLEMetrics(@scheduledSecs INT, @loggedInSecs INT, @productiveSecs INT, @infeedCount FLOAT, @outfeedCount FLOAT, @wasteCount FLOAT, @packageCount FLOAT, @standardRate FLOAT, @period VARCHAR(50)) RETURNS TABLE
```
Mirrors `mes.fnGetOEEMetrics`'s shape - the shared function every OLE/POLE proc calls to turn raw seconds/counts into `oleAvailability`, `poleAvailability`, `performance`, and `quality`. Callers multiply these together for the final `ole`/`pole` scores. `spGetOLEDataAsset`/`spGetOLEDataAssetByInterval` only take `performance`/`quality` from this function's output - they compute their own `oleAvailability`/`poleAvailability` directly, since those two need different `scheduledSecs` denominators (see below).
---
#### Stored Procedures
```sql
mes.spGetOLEData(@userId INT, @assetId INT, @startDate DATETIME, @endDate DATETIME, @attributionMode VARCHAR(20))
```
Single-range OLE/POLE for one operator on one asset - or every operator in the "crew" (scheduled **or** logged into the asset during the range) when `@userId` is `NULL`.
`@attributionMode` defaults to `'EvenSplit'` if `NULL`.
Setting `@userId` to `NULL` returns one row per crew operator.
```sql
mes.spGetOLEDataByInterval(@userId INT, @assetId INT, @startDate DATETIME, @endDate DATETIME, @interval VARCHAR(10), @attributionMode VARCHAR(20))
```
Hour/Day/Week bucketed version of `spGetOLEData`. Adds `@interval VARCHAR(10)` (`'Hour'` / `'Day'` / `'Week'` / `NULL` for auto-sized buckets based on range length). Note: `@interval` controls **bucketing granularity** only - it is *not* the same thing as the rate's `@period` basis (which still comes from `fnGetStandardRateAndPeriod` per-bucket).
```sql
mes.spGetOLEDataByShift(@userId INT, @assetId INT, @startDate DATETIME, @endDate DATETIME, @attributionMode VARCHAR(20))
```
One row per `sch.operatorShiftAssignment` overlapping the range - a rostered shift instance is already a natural bucket. Each row also carries the assignment's `shiftId` (the `sch.shift` it's tied to, if any) for reference. Adds `@assetId INT = NULL`; required when `@userId` is `NULL` (there's no "every user's every shift" mode). Unlike the other procs, there's no login-session union here - a shift bucket only exists where there's a schedule row, so an off-schedule login has no shift-shaped bucket to appear under.
```sql
mes.spGetOLEDataAsset(@assetId INT, @startDate DATETIME, @endDate DATETIME)
```
Single-range, **whole-crew-combined** OLE/POLE for one asset, or aggregated across every `oeeEnabled` descendant asset when `@assetId` is a site/area. `productiveSecs`/counts come from `mes.fnGetRunTimesAndCounts` (summed per descendant asset); `loggedInSecs` is the sum of all login time across the related asset set.
`oleAvailability` and `poleAvailability` deliberately use **different** denominators here:
- `oleAvailability = loggedInSecs / laborScheduledSecs`, where `laborScheduledSecs` is the sum of every operator's scheduled seconds against this asset or any of its hierarchy ancestors/descendants - it scales with crew size, so it correctly drops below 100% when someone scheduled doesn't show up.
- `poleAvailability = productiveSecs / assetScheduledSecs`, where `assetScheduledSecs` is just the requested range's flat wall-clock duration - unaffected by crew size, since the asset either ran or it didn't regardless of how many people were assigned to it.
`standardRate`/`period` use `MAX()` across descendant assets as an approximation when more than one asset is involved. Backs the dashboard's KPI scorecard tiles.
```sql
mes.spGetOLEDataAssetByInterval(@assetId INT, @startDate DATETIME, @endDate DATETIME, @interval VARCHAR(10))
```
Bucketed version of `spGetOLEDataAsset`, with the same labor-vs-asset `scheduledSecs` split and descendant-asset aggregation applied per-bucket. Backs the dashboard's trend chart.
```sql
mes.spGetOLEOperatorLeaderboard(@assetId INT, @startDate DATETIME, @endDate DATETIME, @attributionMode VARCHAR(20))
```
One row per operator, ranked by POLE descending, aggregated across all of that operator's own shifts (safe to sum - same person, non-overlapping shifts, per `trg_operatorShiftAssignment_noOverlap`) **and** across every descendant asset when `@assetId` is a site/area - an operator who worked two lines under the same site shows up as one combined row instead of missing entirely or being split.
```sql
mes.spGetOLEOperatorAssetBreakdown(@userId INT, @assetId INT, @startDate DATETIME, @endDate DATETIME, @attributionMode VARCHAR(20))
```
The leaderboard's shape pivoted: one row per `oeeEnabled` descendant asset for a single operator, instead of one row per operator for a single asset. Powers the leaderboard's click-through drill-down - turns "this operator's combined POLE is low" into "specifically because of what happened on this one line."
:::tip Unscheduled fallback
Operators with **zero** shift assignments for the asset/range but who did log into it get a single fallback bucket spanning the entire requested range, instead of being silently excluded. A user with *any* real shift assignment is not blended with this fallback - their login time outside scheduled buckets simply isn't counted, to avoid double-counting.
This means "Attendance %" means different things depending on the row: for scheduled operators it's "% of your assigned shift you were logged in"; for unscheduled operators it's "% of the entire requested window you were logged in" - a legitimate but broader question. Low attendance numbers for someone who only recently logged in during a multi-day analysis window are expected, not a bug.
:::
### Python scripting API
All wrappers live under `system.kanoa.operators` (analytics functions are called in Perspective as `_kanoa_.operators.*`).
#### OLE / POLE analytics
```python
def getOLEData(userId, assetId, startDate, endDate, attributionMode)
def getOLEDataByInterval(userId, assetId, startDate, endDate, interval, attributionMode)
def getOLEDataByShift(userId, startDate, endDate, assetId, attributionMode)
def getOLEDataAsset(assetId, startDate, endDate)
def getOLEDataAssetByInterval(assetId, startDate, endDate, interval)
def getOLEOperatorLeaderboard(assetId, startDate, endDate, attributionMode)
def getOLEOperatorAssetBreakdown(userId, assetId, startDate, endDate, attributionMode)
```
#### Crews & shift assignments
```python
def addCrew(crewInfo, userId)
def updateCrew(crewInfo, userId)
def deleteCrew(crewId, userId)
def getCrews(paramsDict)
def addCrewMember(crewMemberInfo, userId)
def removeCrewMember(crewId, memberUserId, endDate, userId)
def getCrewMembers(paramsDict)
def assignCrewToShift(crewAssignmentInfo, userId)
def addOperatorShiftAssignment(assignmentInfo, userId)
def endOperatorShiftAssignment(operatorShiftAssignmentId, endDate, userId)
def deleteOperatorShiftAssignment(operatorShiftAssignmentId, userId)
def getOperatorShiftAssignments(paramsDict)
```
---
### Perspective Components
All under `kanoa/mes/operator/`.
#### Analytics dashboard
Composed into the `kanoa/core/dbp/screens/analytics/oleAnalysisDashboard` screen.
| View | Role |
|---|---|
| `oleAnalysisDashboard` | Screen shell - asset/date/interval/attribution-mode selectors, composes the widgets below, and swaps between the leaderboard and the operator breakdown panel |
| `oleKpiTile` | One reusable scorecard tile (label/value/sub/badge), repeated 6× for Attendance, OLE, POLE, Performance, Quality, and Labor Gap. Hovering a tile shows a description of what it measures |
| `oleTrendChart` | OLE vs. POLE availability over time, via `embr.chart.apex-charts`, timestamp-labeled per the selected interval |
| `oleUtilizationBreakdown` | Two stacked bars: **Asset Time** (Productive / Unplanned / Planned downtime, from `fnGetRunTimesAndCounts`) and **Labor Time** (Logged In / Absent) - kept as two independent bars because `productiveSecs` (asset runtime) and `loggedInSecs` (labor presence) are independent numbers and don't sum to one meaningful total |
| `oleOperatorLeaderboard` | Header + a repeated `oleLeaderboardRow` per operator, ranked by POLE. Clicking a row selects that operator and swaps in `oleOperatorBreakdown` |
| `oleLeaderboardRow` | One leaderboard row: rank, name, Attendance/OLE/POLE as color-coded progress bars, plain Performance/Quality percentages. Sends a page-scoped `operatorSelected` message on click |
| `oleOperatorBreakdown` | Per-asset breakdown table for one selected operator (via `getOLEOperatorAssetBreakdown`), with a Close button that sends `operatorDeselected` to return to the leaderboard |
#### Crew management
Composed into `crewManagementDashboard`, a tabbed shell.
| View | Role |
|---|---|
| `crewManagementDashboard` | Screen shell - tab container hosting the three views below |
| `crewsTab` | CRUD grid for `sch.crew` |
| `crewMembersTab` | Crew selector + membership grid for `sch.crewMember` - add/remove members |
| `schedulingTab` | Assign a crew or an individual operator to a shift (`assignCrewToShift` / `addOperatorShiftAssignment`), and view/end/delete existing assignments |
---
## Known limitations
- **Standard rate must be configured.** If `mes.modeEvent` has no row for an asset, `standardRate` resolves to `NULL`, forcing `performance` (and therefore `ole`/`pole`) to `0` even when availability is good. This is correct behavior, not a bug - it surfaces a missing rate configuration rather than fabricating a number.
- **Scheduling is optional per asset.** Assets/operators with no `sch.operatorShiftAssignment` data fall back to session-derived attendance (see "Unscheduled fallback" above) rather than returning empty results.
- **Overlapping session data will double-count.** `fnGetOperatorSessionSeconds` sums every qualifying session row without merging overlapping intervals - two overlapping (rather than sequential) login records for the same user/asset will inflate `loggedInSecs` past the wall-clock window. This is a data-quality assumption (session records shouldn't overlap), not something the function defends against.
- **`laborScheduledSecs` has the same non-dedup assumption.** It sums every scheduled operator's overlapping seconds without merging - `trg_operatorShiftAssignment_noOverlap` prevents the same operator having two overlapping assignments to the *same* shift or asset, but two operators legitimately assigned to the same asset at the same time (a multi-person crew) are correctly summed, by design.
- **Descendant-asset aggregation calls per-asset functions in a loop.** The whole-asset and leaderboard procs call `fnGetRunTimesAndCounts`/session/productivity functions once per descendant asset (and, for the leaderboard, once per bucket-row too). Fine for a handful of lines per site; worth revisiting if that number grows large.