# Start Your Shift
When you take over a machine, the first thing to know is where it's at: is it running, what's it making, and is anything
waiting for you? This lesson shows you how to open your machine in Kanoa and read all of that from one panel.
## Open Your Machine
You can reach your machine's Asset Operation screen in two ways.
**From the Asset Overview dashboard.** If your home page is the Asset Overview dashboard, click your machine's tile. This is
the quickest way.
**From the menu.**
1. Open **Ops → Operations → Asset Operation** from the navigation menu.
2. If the screen shows cards instead of a machine, you're at a site, area or line. Tap the card for the area your machine is
in, then tap your machine. **Up to *parent*** next to the heading takes you back a level.

Each machine's card shows its mode and state, such as *Production · Running*, and the order it's running.
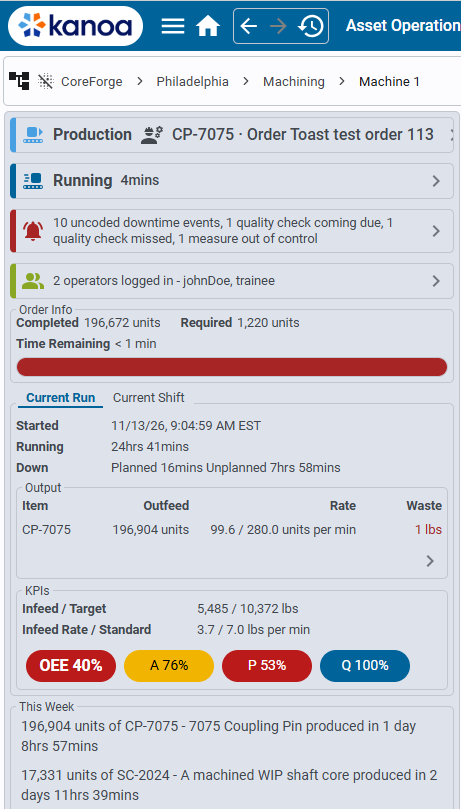
When you've opened your machine, the screen looks like this. The **info panel** is on the left. The tiles at the top right
open the screens you'll use during the shift, such as **Run Control** and **Downtime**, and the dashboard under them shows
how the machine has run.

:::tip
On a tablet running **kanoaTablet**, you start on the same cards. Step down to your machine and tap it.
:::
## Read the Info Panel
The **info panel** on the left of the screen shows your machine as a stack of cards. Read it top to bottom when you take
over.
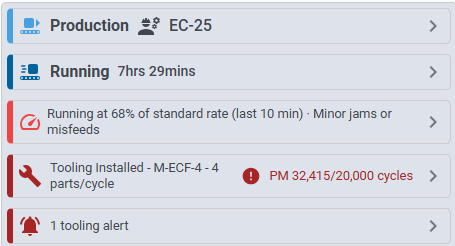 | Card | What it tells you at the start of a shift |
| --- | --- |
| **Production** | The machine's mode, such as *Production* or *Idle*, and the product and order it's running. |
| **State** | Whether it's running or down right now, and for how long. |
| **Speed loss** | Only shown while the machine runs below its standard rate: how far below, and why. |
| **Tooling** | Only on machines that use molds or dies: the tool that's mounted, and how close it is to its next limit. |
| **Notifications** | What needs your attention: uncoded downtime this shift, quality checks coming due, and alerts. |
| **Operators** | Who is logged in on the machine now. |
A chevron (›) on the right of a card means you can tap it to change what it shows. You'll use those in the next lessons.
### Check the Notifications Card
The **Notifications** card's stripe tells you at a glance whether anything is waiting: green for nothing, orange for
something, red for something urgent. Tap it to see the list. Each notification opens the screen you need to deal with it.
Make a habit of checking it at the start of every shift. Downtime left uncoded by the last shift, or a quality check about
to come due, is easier to deal with now than at the end of your shift.
### Check You're Logged In
The **Operators** card shows who is badged in on the machine, such as *1 operator logged in - johnDoe*. Being logged in
here isn't the same as being signed in to Kanoa: it records that you're working this machine, and it's how your time on
the line is counted.
 If your name isn't there, ask your supervisor to log you in. Logging operators in and out usually needs a supervisor's
permissions, so you can open the card and see the sessions, but you may not be able to change them.
## Read the Shift So Far
Under the cards, the **Current Shift** tab shows how the shift has gone so far:
- **Shift**: the shift and its times.
- **Started**, **Running** and **Down**: how much of the shift the machine has run and how much it's been down.
- **Output**: what it has made, how fast, and how much was wasted.
- **KPIs**: the count against target, the rate against standard, and OEE.
The **Current Run** tab shows the same for the run that's going now. **This Week** lists what the machine has made this
week.
::embed-section{src="../../kanoa-ops/asset-operation.md#the-info-panel" collapsed="true" summary="Reference Materials: The Info Panel - Every card, what it shows and what it opens."}
## Check Your Understanding
1. Where do you look to see whether the machine is running right now, and for how long?
2. The Notifications card has an orange stripe. What does that mean, and how do you find out more?
3. Your name isn't on the Operators card. What do you do?
Answers
1. The **State** card on the info panel.
2. Something needs your attention, but nothing urgent. Tap the card to see the list, and tap a notification to open the
screen that deals with it.
3. Ask your supervisor to log you in.