KPI Matrix
The KPI Matrix functionality is a tool to provide insight to production KPIs. The user will have the ability to rapidly analyze the chosen KPIs from tag data.
Login
To login, in the upper right corner - click the login icon. Use your ID and Password to login to the application.

User Permissions
Once logged in, you can hover over the login icon and see your current roles for the application.
Logout
Click the logout icon next to the login icon to logout of the application.
Roles & Permissions
The roles granted to the users of the application have different permissions.
Division Admin
The Division Admin can view all matrices, both public and private. They can create, edit and delete their own matrices. The can delete any matrix, both public and private.
Site Admin
The Site Admin can view all public matrices as well as all their own. They can view any private matrix within their own site. They can create, edit and delete their own matrices. They can delete any matrix within their own site.
User
The User can view their own public and private matrices, and any other public matrix. They can create, edit and delete only their own matrices.
Guest
The Guest can only view public matrices. They have no create, edit or delete permissions.
Create and Edit a KPI Matrix
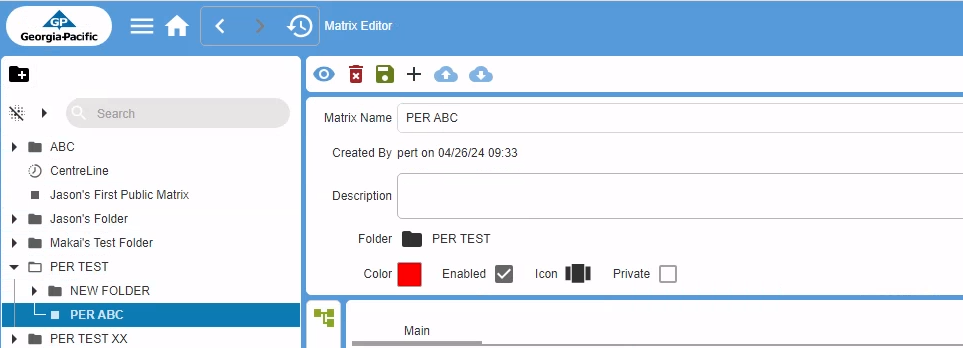
Matrix Editor
To create or edit a Matrix - start by open the left menu and click the Matrix Editor. This will open a view to the Matrix editor.
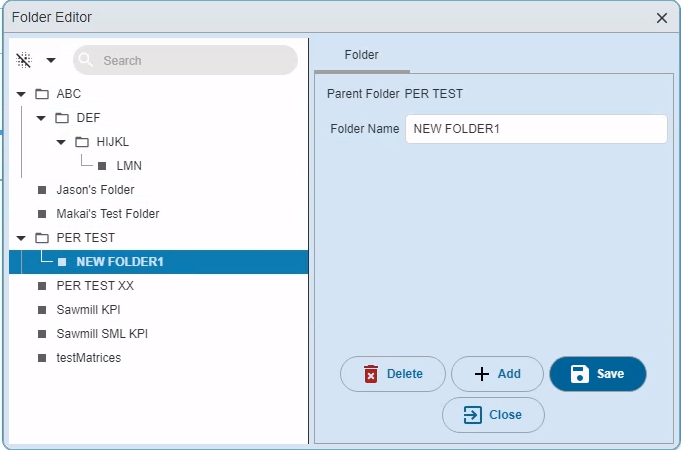
Folder Editor
Folders are managed in the Folder Editor - the user can create, edit and delete folders. Click the + icon above the matrix tree structure for the pop-up window with the Folder Editor:
- Add folder - in the Folder Editor, select the parent folder, click the Add button, enter the folder name and Save.
- Edit folder - in the Folder Editor, select the folder to edit and make the required changes. Then Save the changes.
- Delete folder - in the Folder Editor, select the folder to delete, click the Delete button.
Create / Edit a Matrix
- Create a new Matrix - select a folder for the location of the Matrix. Fill the matrix info - name, folder, icon and sort order. Click the Enabled box to enable data to flow to the matrix so it can be viewed. Save the Matrix using the Save icon in the top menu.
- Edit an existing Matrix - select the Matrix, change the info of the Matrix as needed (Name, Icon, Color, Sort Order).
- Matrix Groups - Organize the Matrix data by setting up groups. Minimum one group must be created. Create a name for each group, set background color for group.
- Add data tags - Click the selector tree for data tags. Each data tag selected will be added to the group. Once done with selection - close the selector window with the Close button at the bottom.
- Delete data tags - Select a data tag and click the Delete icon in the left menu. Confirm.
- Drag and Drop - Drag and drop a matrix from one folder to another. Select the matrix, hold the left mouse button until it is in the desired folder and then release the mouse button.
View a Matrix
Matrix view
In the KPI Matrix view - you will be able to see the data from the selected Tags. There are options for data intervals, how to group the data, and for how the data will be presented.
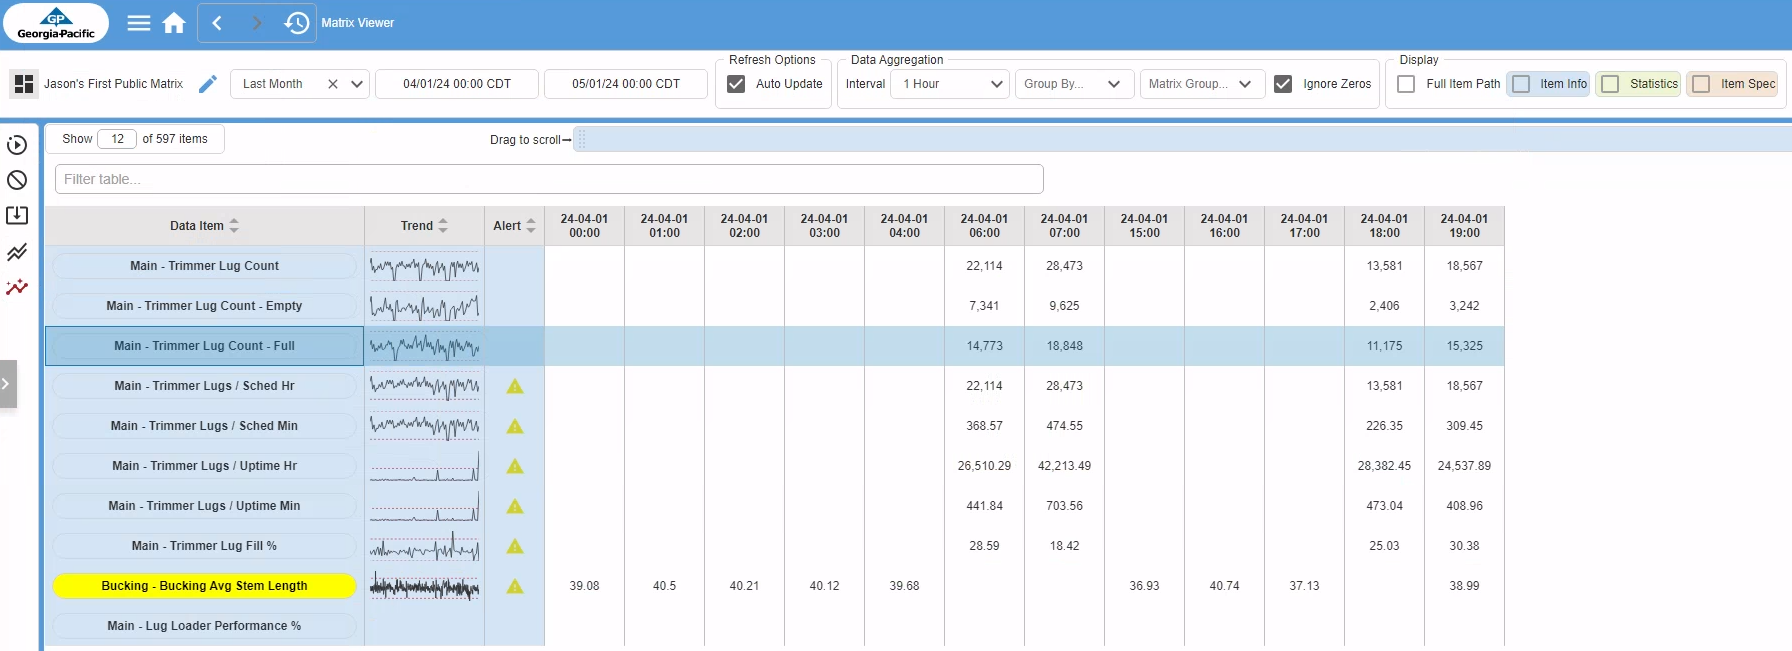
Normal Use Case:
- Select the Matrix
- Set the time period for data
- Set data interval (default 1 hr)
- Check choices for Ignore Zeros and Show Summary
- Set Row vs Column view
- Click Get Data - bring in data
- Select Data tag to inspect further
- Click Trend View
Filters and Data View Parameters
- Matrix Selector - select the Matrix to be presented. Use the search function to search in folders.
- Data period - select the time period for the data to be presented - choices are today, yesterday, this week, last week, this month, etc. Or set a custom time period. Set the start date and time and end date and time.
- Data Interval - select the data interval for the aggregated data. The data is aggregated in intervals of 1 hr, 30 mins, 15 mins
- Group by Shift, Run or Crew - this to sort by a specific Shift, Run or Crew.
- Group by Matrix Group. This can be utilized if the Matrix data is organized by separate Matrix groups.
- Ignore Zeros - when this is checked, zero values will be ignored. If all values for a tag are zero, the tag will not be displayed.
- Refresh Options / Auto Update - automatically update the table data whenever a filter parameter changes.
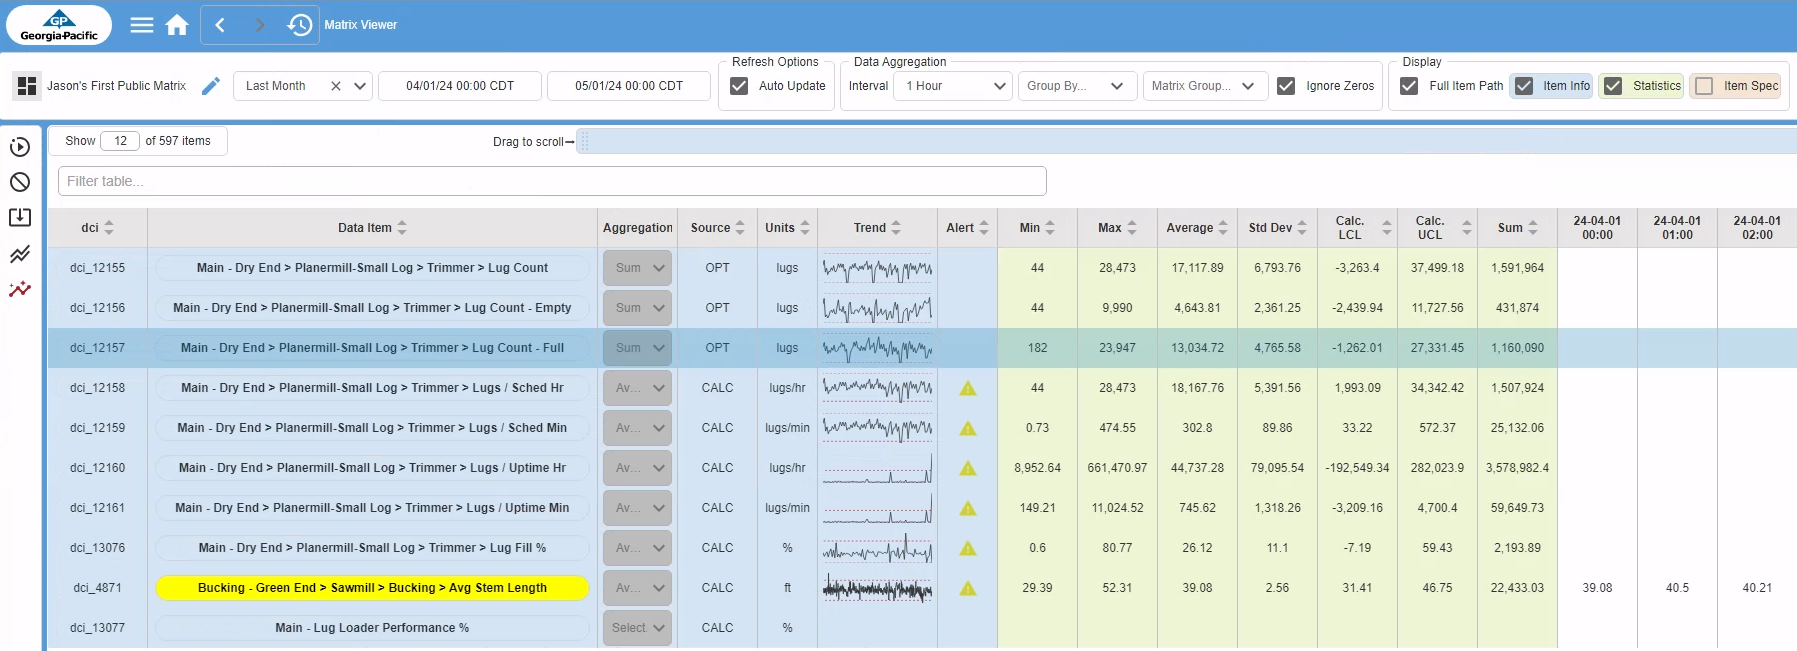
- Full Item Path - this will show the full data path when checked
- Item Info - this will show the data source (tag, calculation) and default aggregation mode when enabled.
- Statistics - summarized values for the chosen data will be presented when enabled.
- Item Spec - when enabled this will show the data item specifications set for control limits, LCL and UCL. When no limits are set, they are calculated from data values.
Alerts
- KPI Matrix data alerts - alerts are set when data are outside calculated or spec control limits. Data values outside limits are color coded in the table.
Left Menu icons
- Clear table - Click this icon to clear the displayed data.
- Export data - Click the export button to export the data displayed in Excel format.
- Trend View - Select a single data tag and plot the trend over a time period.
- Production View - Select multiple data tags to plot the views over a time period.
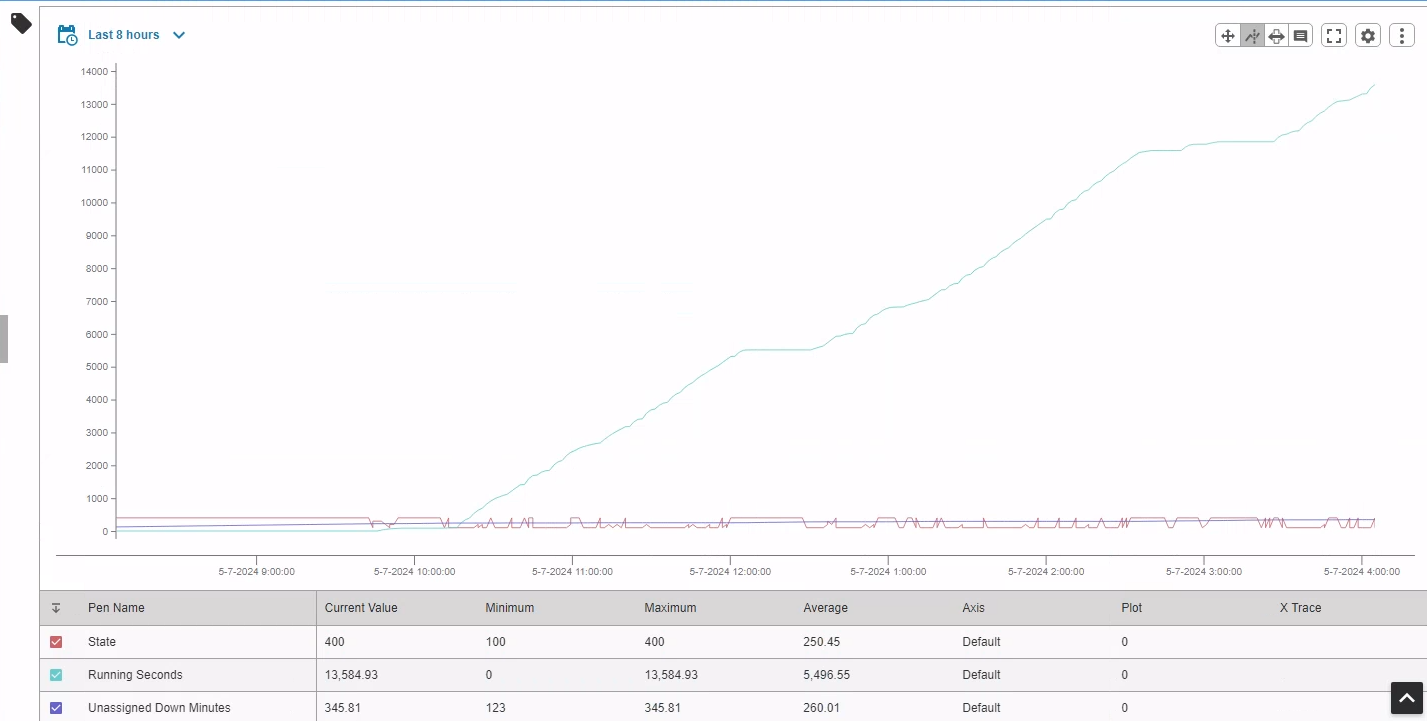
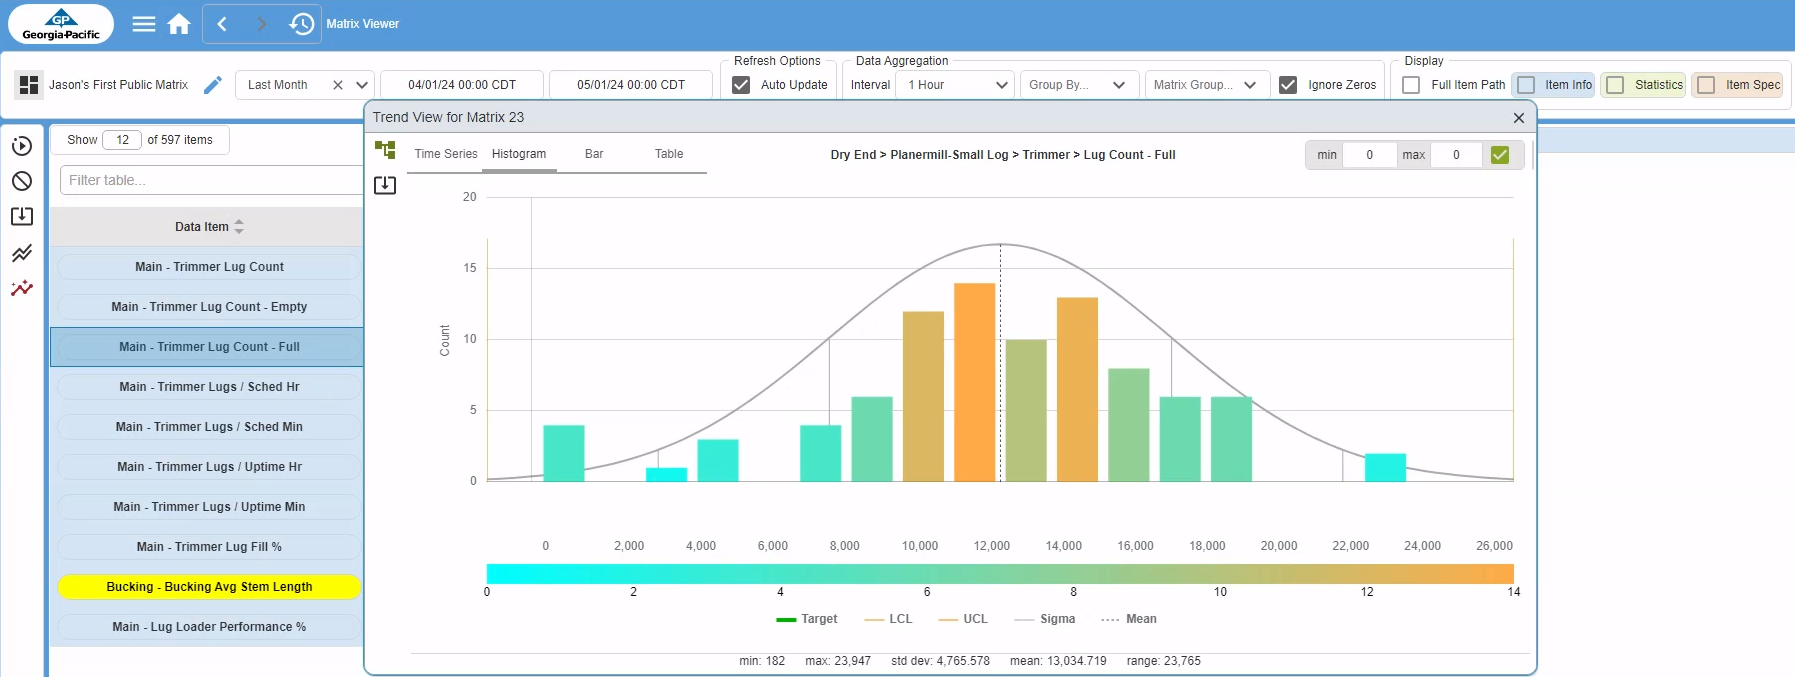
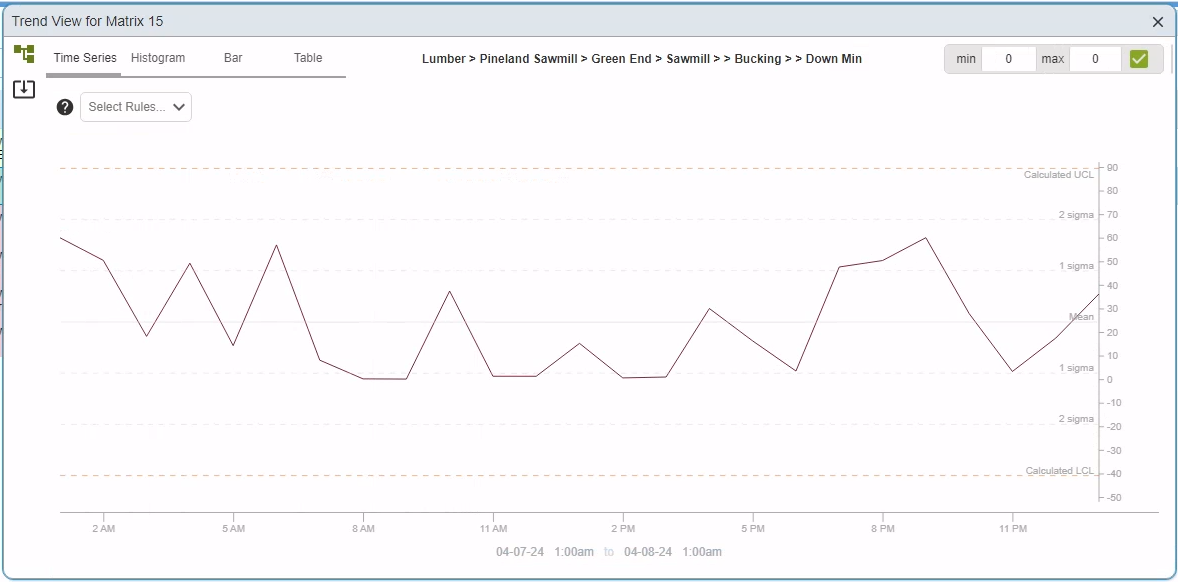
Trend View
Trend Views displays a single tag over a chosen time period.
- Time Series - Select the Time Series format to plot the data in a time series. Use the Nelson and WECO rules to determine if the graph is unpredictable.
- Nelson Rules are a method to determine if some measured variable is out of control (unpredictable vs consistent). Read more about the Nelson Rules here: https://en.wikipedia.org/wiki/Nelson_rules
- WECO Rules to detect out of control r non-random conditions in your control charts. Read more about the WECO (Western Electric) Rules here: https://en.wikipedia.org/wiki/Western_Electric_rules
- Bar Chart - Select the Bar format for the data to be displayed in bar chart.
- Histogram - select a data tag to show the distribution of the data. Select Min and Max values to limit outliers.
- Table - Select the Table format for data in raw table format
- Export data - click the export button to export the data in Excel format.
Production View
This to view multiple plots of aggregated data over a chosen time period. Select multiple data sets (use CTRL button to select multiple sets) to compare and click the Production View icon. Select the desired view. Or use the selection tree to pick the data sets to plot.
- Time Series - select the Time Series format to plot the data in a time series. Select the Separate plot box to separate the data series.
- Bar Chart - Select the Bar format for the data to be displayed in bar chart for comparison. Click the Separate Plot to separate the data series.
- Table - Select the Table format for data in raw table format
- Export data - click the export button to export the data in Excel format.
Tag History Browser
The Tag Browser provides a view to the database tag history - to review tag data for KPI Matrix plot usage.
Tag History Viewer
Select Tag History in Left Navigation to open the Tag History Viewer. The usage of the browser itself is documented at Inductive Automation. https://docs.inductiveautomation.com/docs/8.1/appendix/components/perspective-components/perspective-chart-palette/perspective-power-chart
Tag Selector
- Tag Selector - Click the Tag icon to open tag selector
- Add Tags - use the filter field to find tags. Select the tag and click the Add icon (+) to add the tag. Repeat for multiple tags.
- Remove Tags - Select an added tag and click the Remove icon (X) to remove a tag from selection
- Display Tag History - Once the selection of tags has completed - click the Show button to view the tags and Close button to close the Tag Selector window.