Reliability KPI's
OEE may be an important indicator of how well your plants are performing, but if your assets spend most of the time idling, in maintenance or changover,
increasing production or reducing setup time may be the better solution to drive efficiency. The Reliability KPIs page is designed to offer in-depth insights
into the reliability aspects of all assets across your enterprise, by showing the total utilization of all your assets along with a 'Loss Bucket' summary and detail chart.
Filters
You can get a 30,000ft view of utilization and losses across all assets within your enterprise, but if you want to focus on just one asset or a group of assets,
you can select assets by site or area using the asset selector or use the asset group selector to filter for specfic types of assets. assets can be added to an asset
group in the asset configuration page.

- Asset Selector: Click on the asset selector
 to choose assets.
 - Date Range Selector: Select from our pre-defined list of time periods such as 'Today', 'Yesterday', 'Last Week', 'This Month', 'Last Month', 'Year To Date' or select a custom range.
- Asset Group: Only show data for assets that belong to the selected asset group. Asset Groups are configured in the Asset Configuration screen.
- Short Stop: Define how long a downtime event can be to be considered a short stop (or minor stop).
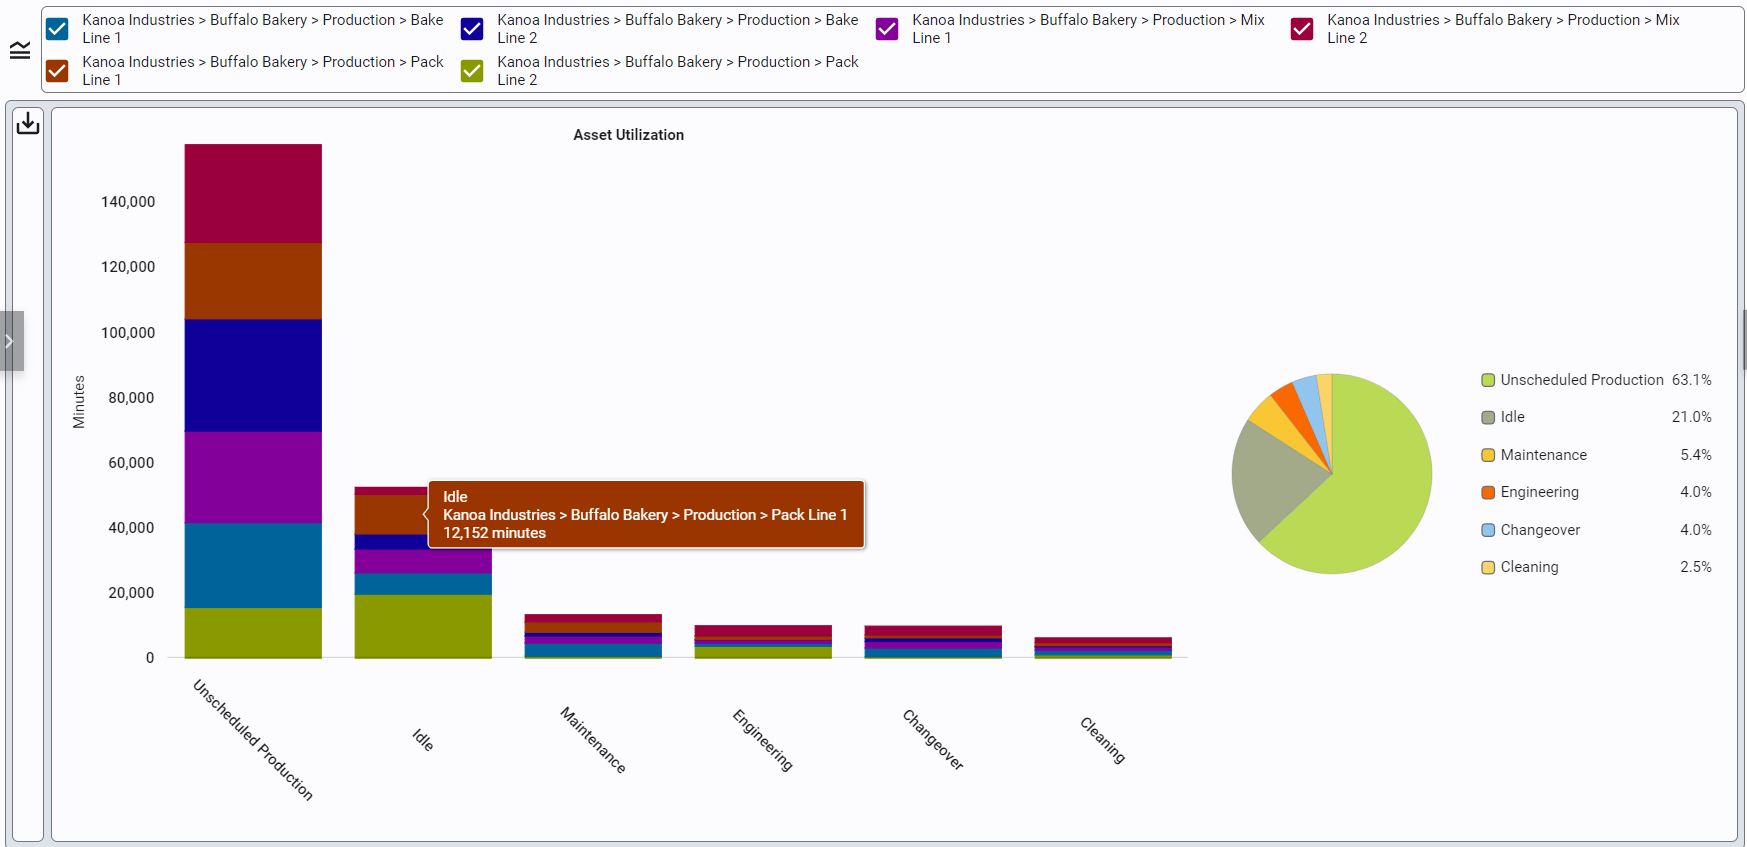
Asset Utilization
Does your plant have the available capacity to take on more production? Are assets idling away or in maintenance, cleaning, engineering and changeover activities
eating away at your availability to product more? The Asset Utilization Chart stacks an assets duration by mode in bar chart and also sums total duration for each mode
so you can see where the time is being used. If an asset is determined be in production outside of scheduled production, the chart will show how time is split
between scheduled and unscheduled production.
To truly gain deep insight into how your assets are being used, schedule information is crucial, and we strongly recommend that while you may have a different solution for scheduling, whether that is done in ERP or excel, that information needs to be shared with MES. Why? Because data is only useful if it is contextualized and keeping schedule information separate from production information limits your ability to gain insights into 'just how well are we scheduling?'. In fact we would go so far as to say that poor scheduling of resources in terms of asset, material and personnel may well be your No.1 cause of inefficiency. Whether you use our built-in scheduling solution or a third party, integrating production scheduling information into the MES application is an important step in driving continuous improvement.
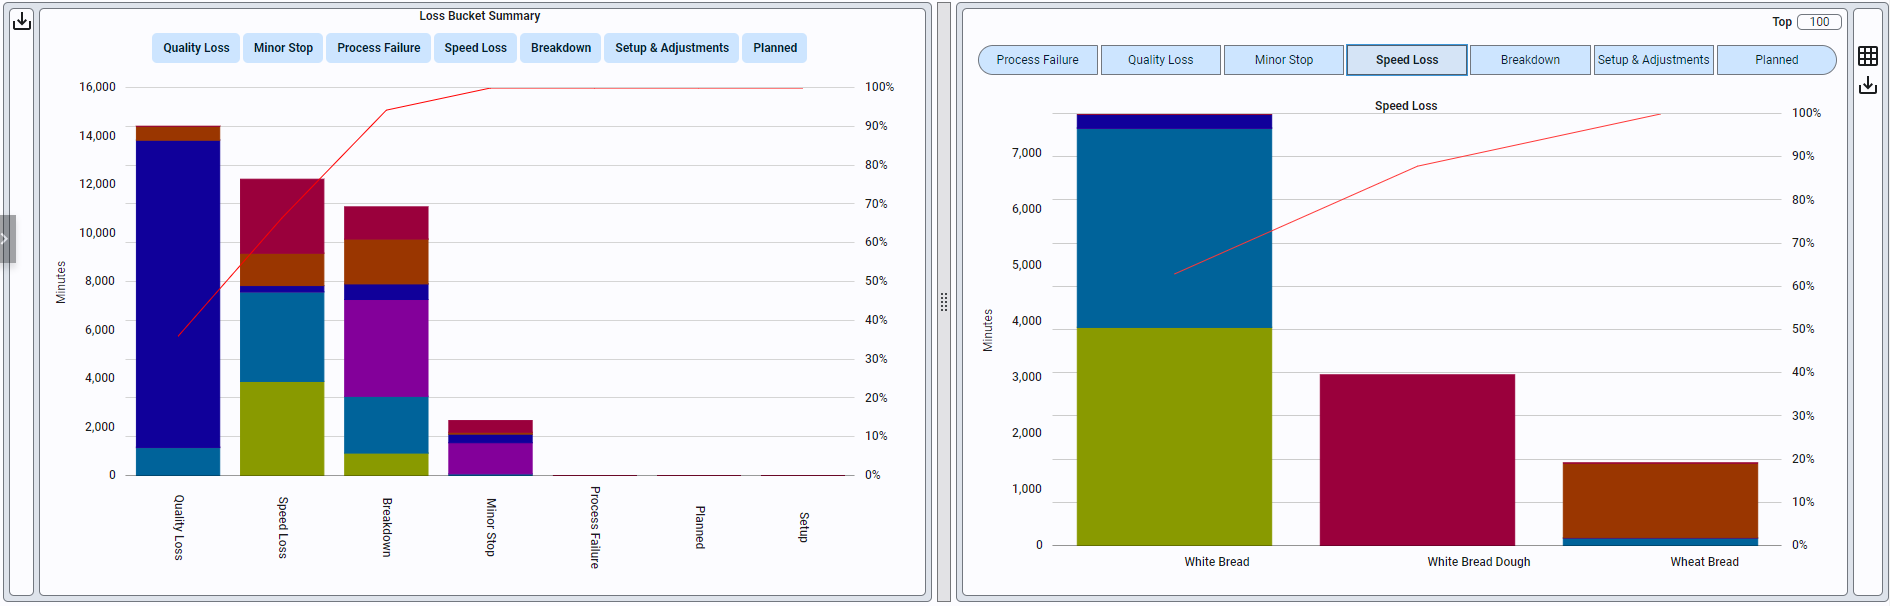
Loss Buckets
An interesting name we wont go into, 'loss Buckets' is another way of categorizing all the different reasons we may consider contribute to lost opportunities to sell more product or reduce the cost of making products. It does this by taking downtime, scrap and reduced production rates (the A, P, Q portions of OEE) and putting them all into the same units of minutes. The idea behind this is that you may be focused on eliminating downtime, but scrap or slowed production could be your number one enemy. By putting all of these into 'loss minutes of production' you can now easily see at a glance whether Quality Loss, Speed Loss or Minor Stops is the main culprit.
You can click on any part of the bar chart in the Loss Bucket Summary Chart to see all the reasons for that asset that contributed to that loss bucket in the Loss Bucket Detail chart. Yuo can also click on one of the Loss Bucket button in the Loss Bucket Detail chart to see all reasons for all assets that contributed to that bujcket.
- Quality Loss: The total amount of scrap generated by an asset is multiplied by the taKt time for an item. i.e. if the standard rate detmerines that the asset should produce 1 part every 3 minutes (taKt time), then the Quality loss for 100 parts that need to be scrapped or reworked is 100 * 3 = 5 hours.
- Speed Loss: The amount of time lost while an asset produces at a rate less than the standard production rate expected for the asset. i.e. If the standard rate is 100 parts per minute and the asset ran for 5 hours at a reduced rate of 50 parts per minute, then the Speed Loss will be 2.5 hours.
- Minor Stop: The total amount of time the asset was in an unplanned downtime state for less than the defined 'short stop'.
- Process Failure: The total amount of time the asset was in an unplanned downtime state that is not considered a minor stop and did not require a part replacement.
- Break Down: The total amount of time the asset was in an unplanned downtime state that is not considered a minor stop and did require a part replacement.
- Setups & Adjustment: The total amount of time the asset was in a planned downtime state that is set to the state Category 'Setups & Adjustments.
- Planned: The total amount of time the asset was in a planned downtime state that is not set to the state Category 'Setups & Adjustments.
Additional Features
- Data Export: Almost every chart includes an export data button for downloading information in CSV format.
- Data Table: Below the charts, a table displays the raw data that comprises the Loss Bucket Detail Chart. This data can exported so that you can share it with whoever you want or use it in an excel spreadsheet.