Speed Loss
When a machine runs a production run slower than its standard rate, Kanoa MES records the lost output as it happens: an automatic performance event with a reason, shown on the Operator Station so the operator can say why.
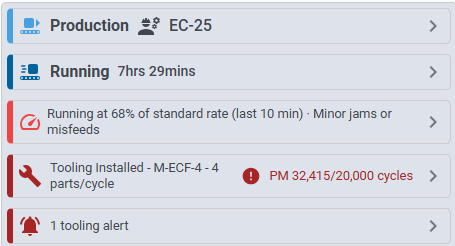
What Counts as Running Slow
Every minute the gateway checks each OEE machine that is running (its state is a Running state) a production run (a Production mode with an item and a standard rate per minute or hour):
- Actual rate is the machine's count over the last 10 minutes divided by the minutes it was running in that time. The infeed count is used; a machine with no infeed count uses its outfeed count times the package count.
- It's slow when the machine has been running for the last 5 minutes and the actual rate was below 95% of the standard rate at every minute of them. Short dips don't count, and a slow run is flagged 5 minutes after it starts.
- A machine reported as Running with no counts at all is a speed loss too.
The defaults can be changed with the configuration values speedLossWindowMins, speedLossThresholdPct and
speedLossMinMins, and for one machine (or everything under a site, area or line) with the asset attributes
_speedLossWindowMins, _speedLossThresholdPct and _speedLossMinMins. The closest one up the asset tree wins.
Turning Real-time Speed Loss Off
Real-time speed loss is on for every OEE machine. To turn it off, for example for a site that doesn't track speed losses, select the asset in the asset tree editor and clear Enable Real-time speed loss in its OEE settings, under the OEE thresholds.
- The setting is inherited: an asset follows the closest asset above it that has its own setting. Turn it off on the enterprise or a site, and every machine under it is off too.
- To give one asset its own setting, clear its Inherited checkbox and set the checkbox; tick Inherited again to go back to the parent's. A top-level asset has nothing to inherit from, so it has no Inherited checkbox.
- While it's off, the machine isn't checked: no speed-loss events open, an event that's still open closes, and the info panel shows no speed loss card.
The setting is the asset attribute _speedLossEnabled (1 on, 0 off). The configuration value speedLossEnabled, if
set, is the default for assets that have no setting above them.
The Speed-Loss Event
When a machine turns slow, a performance event opens on its run:
- It starts at the first of those 5 minutes and stays active (no end yet) while the machine is slow. Reports and widgets count an active event up to now.
- Its value is the minutes of output lost so far: the minutes running, minus what was made divided by the standard rate per minute. It's updated every minute.
- It ends when the rate has been back above 95% for 5 minutes (it ends where the recovery started), when a new run starts (it ends at the new run's start), or when the machine stops running. Downtime is an availability loss, not a speed loss.
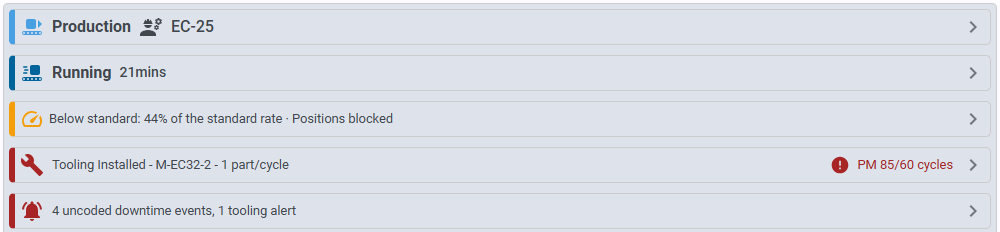
- Its reason starts as Unassigned (reason class Speed Loss), or Positions blocked (class Tooling) while a position of the mounted tool is blocked. These are chosen by the system and can change while the event is open.
Setting the Reason
While the machine is slow, the info panel shows a speed loss card under the state, for example Running at 50% of standard rate (last 10 min) · Unassigned, with a stripe in the reason's colour. The rate is over the last few minutes (the window above), so it can differ from the run's Output and Infeed rates and its P, which are over the whole run: a machine that made nothing in the last 10 minutes reads 0% even if its run so far is close to standard. Tap the card (it needs the Edit Operations security function), pick the real reason in the Set Speed Loss tree and add a note if needed, then click Save. A reason set by hand is kept: the system doesn't change it again.
Picked the wrong reason? Open the card again and click Clear reason. The event goes back to the reason the system gives it (Unassigned, or Positions blocked), and the system keeps that up to date again.
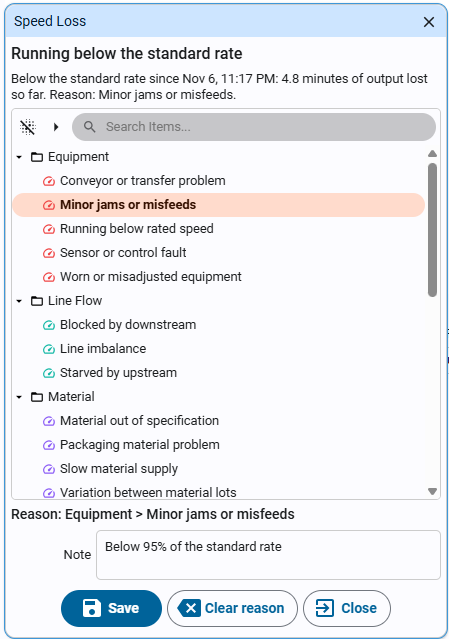
The tree offers the performance reasons linked to the machine, or to anything above it (its line, area, site or enterprise), in Configuration > Ops > Performance Reasons, grouped by reason class. If none are linked, the popup says so: link a reason class to the site, for example, to give every machine in it the same reasons.
Reports
- In Ops > Performance Events, an automatic event whose reason is still the system's (Unassigned or Positions blocked) isn't counted as coded loss, so it still shows as loss to explain. Once a reason is set, it counts.
- Adding performance events by hand works as before. If a person's event overlaps an automatic one on the same run, the automatic one is left out of the reports and widgets, so the same lost minutes are never counted twice. Setting the reason on the automatic event is usually simpler than adding a new one.
Tags
Each OEE machine's OEE/Current Run folder in the kanoaMES tag provider has the speed-loss tags the badge uses, written by the check every minute. For example, [kanoaMES]CoreForge/Philadelphia/Molding/Injection Press 1/OEE/Current Run/belowStandard:
| Tag | Meaning |
|---|---|
| belowStandard | True while an automatic speed-loss event is open. |
| actualRate | The actual rate over the window, in the run's period (per minute or per hour). |
| actualRatePct | The actual rate as a percentage of the standard rate. |
| performanceEventId | The open speed-loss event, or empty. |
| performanceReason | Its reason. |
| performanceReasonColor | Its reason's colour. |
| speedLossWindowMins | The minutes the actual rate is measured over (the window). |
system.kanoa.event.checkSpeedLoss(assetId) runs the check for one machine on demand, and
system.kanoa.event.setPerformanceReason(performanceEventId, performanceStateId, note, userId) sets an event's reason
(performanceStateId None clears a reason set by hand).