Read SPC
A check can pass every time and still show a problem coming. Statistical Process Control (SPC) looks at many results over time, so you can spot a drift before a part goes out of spec. This lesson shows you how to open Check Details, read a chart and recognize a rule violation.
SPC only uses checks that are Approved. A check that is still Submitted, or has been rejected, isn't in the chart.
Open Check Details
- Open Quality → Analysis → Check Details.
- Select the check sheet whose results you want to see, such as a measurement check that runs every shift. Filter by asset
or item if you need to, and choose a date range. At CoreForge,
Coating SPC Checksis a good one to try. - Get the data. Each timestamp is one time the check sheet was performed.
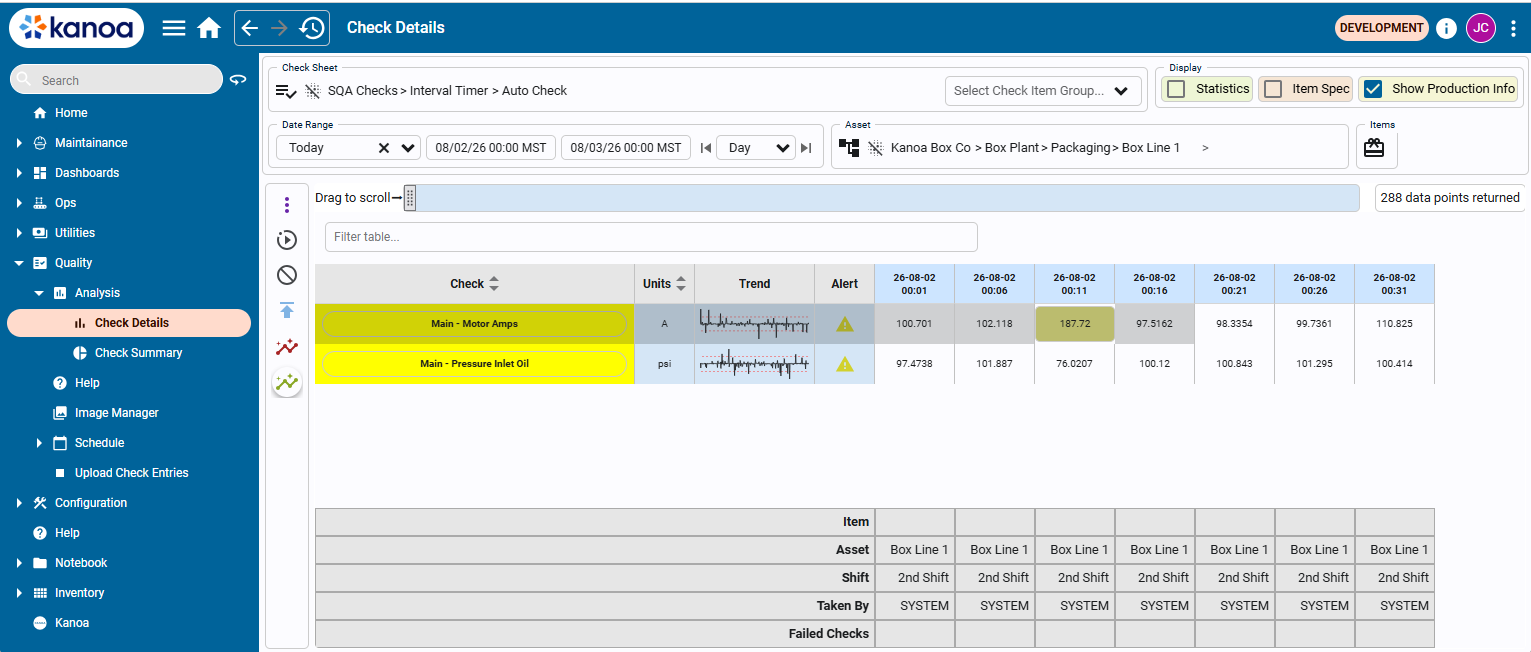
Turn on these options to see more:
- Statistics shows the min, max, average, standard deviation and calculated control limits.
- Show Production Info adds the item, asset and shift.
- Show Item Spec shows the spec limits, if they're set.
You can show check items as columns or rows. Columns are faster for large amounts of data and add the min, max, average and standard deviation.
Read the Trend Chart
- Select a check item in the table.
- Click the trend icon to open the Trend View.
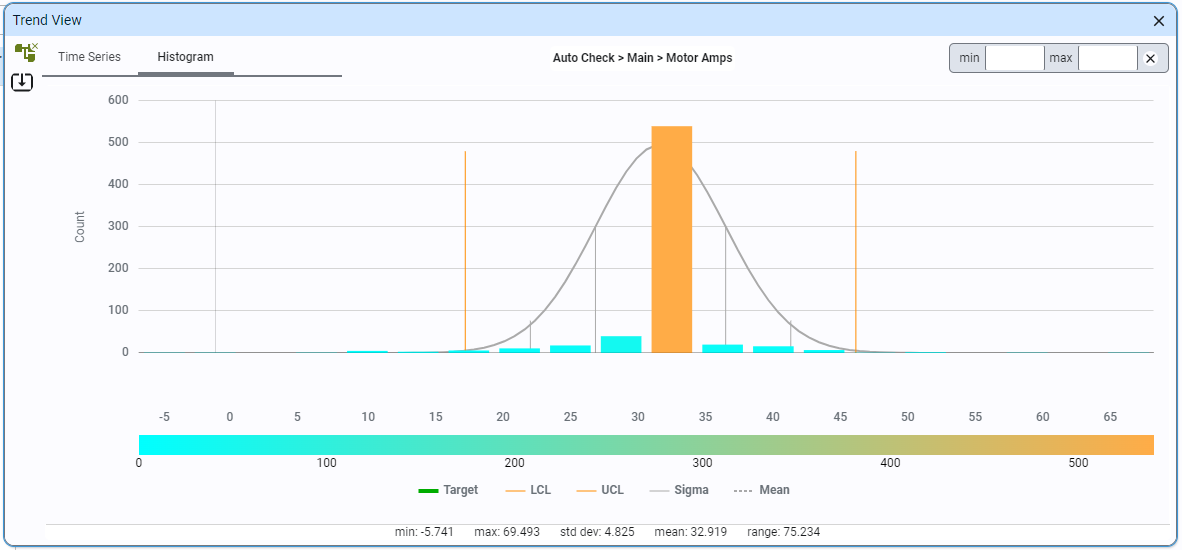
- Switch between Time Series, Histogram, Bar Chart and Tabular.
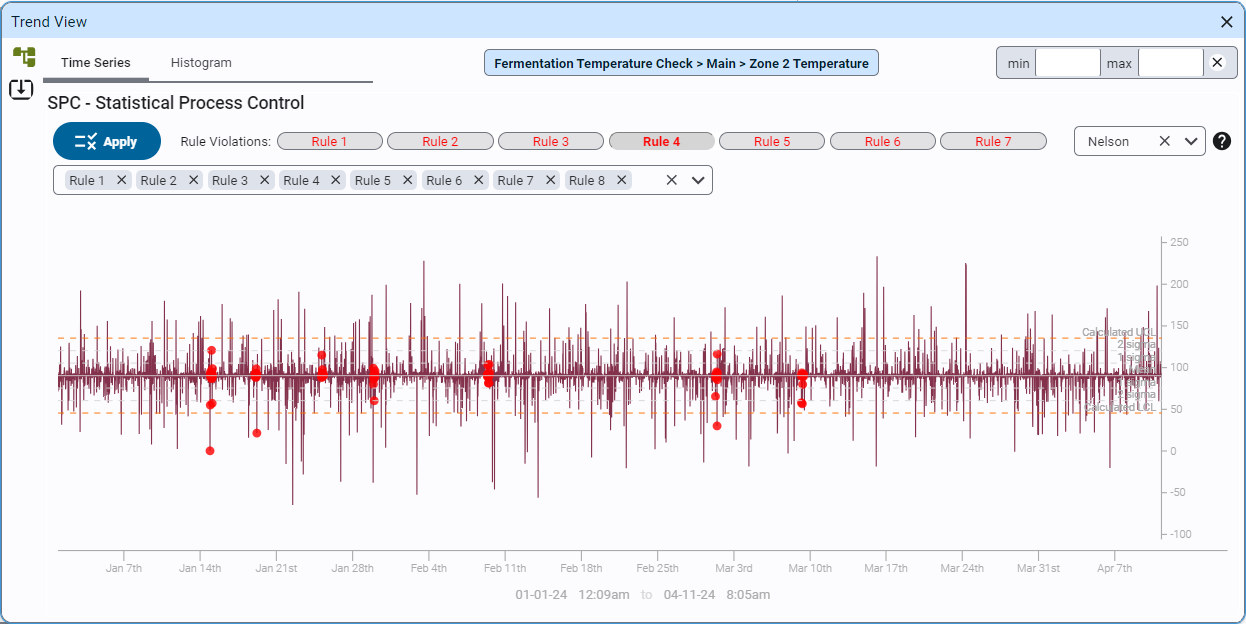
The time series shows your readings over time with the calculated upper and lower control limits. The histogram shows how the values are spread, so you can see whether they're centered and whether there are outliers.
Choose a rule set from the rules dropdown: Nelson, WECO (Western Electric) or Custom. Rule violations are
highlighted on the chart.
Recognize a Rule Violation
A rule violation means the points show a pattern that is unlikely to be chance. It can happen while every value is still in spec. The rules fall into three kinds.
| Kind | What it means | Examples |
|---|---|---|
| Limit | A point is beyond a control or spec limit. | Above UCL, Below LCL, Beyond 3σ |
| Pattern | A run of points shows the process has shifted, is drifting or is unstable. | 8 on one side, 6 trending, 2 of 3 beyond 2σ |
| Variation | The points hug the center line, with too little variation. | 15 within 1σ |
For example, six points that keep climbing are a 6 trending violation. A run of points all on one side of the average is a shift, even if none crosses a limit.
When you see a violation:
- Note which rule fired and when.
- Look at the item, asset and shift for those points. Show Production Info helps here.
- Tell your supervisor or follow your plant's procedure.
Open a Control Chart
For a numeric check item you can also open the Control Chart from the table, using the control chart icon.
- Pick a chart type. For single readings, choose Individual Readings (I-MR).
- Optionally choose a rule set: Western Electric, Nelson or both. Violations show as red points on the Control Chart tab.
- Optionally enter the spec limits. This adds a Capability tab.
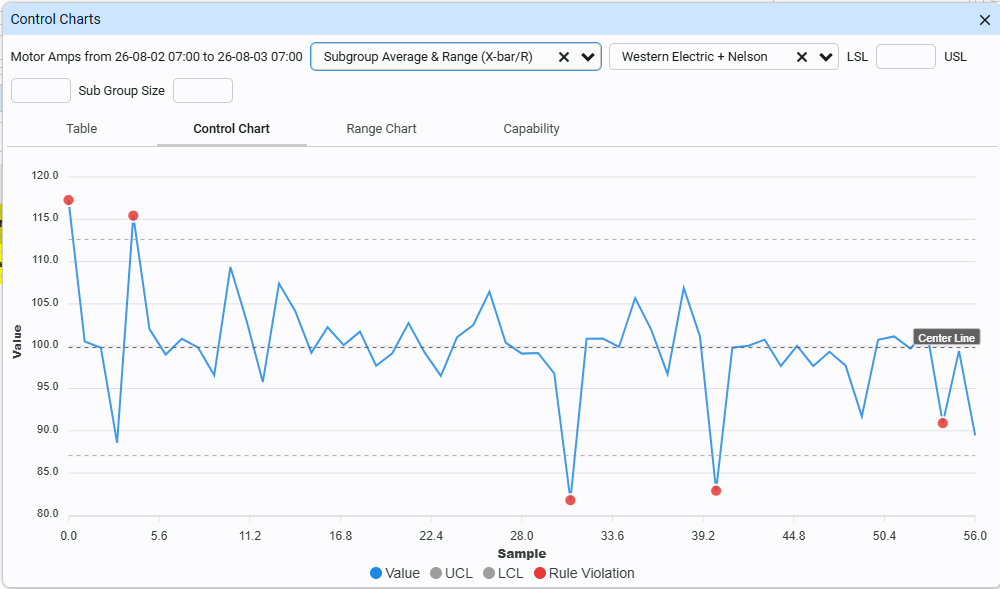
Being in control and being capable are different. A stable chart with no violations can still produce scrap if the process is wider than the tolerance. Ask your quality engineer how to read the Capability tab.
Reference Materials: Applying SPC Rules - Rule sets and chart types in the Trend View.
Applying SPC Rules
Nelson and Western Electric SPC rules can be applied to any trend: choose Nelson, WECO (Western Electric) or Custom from the rules dropdown. Rule violations are highlighted on the chart.
Users can export trend data to a CSV file for further analysis.
The charting can be switched between...
- Time Series: Displays a time series chart of the check sheet data, including calculated upper and lower control limits.
- Histogram: Shows a histogram of all collected data, with hover-over functionality for detailed counts in each bar.
- Bar Chart: Shows a Bar Chart of all collected data, with hover-over functionality for detailed counts in each bar.
- Tabular: displays the raw data in a table.
Check Your Understanding
- Does a rule violation mean a part is out of spec?
- Which checks does SPC use?
- Which three kinds of rule violation can you see?
Answers
- Not necessarily. It means the points show a pattern unlikely to be chance, even if every value is in spec.
- Only checks that are Approved.
- Limit, pattern and variation.