
Review Operator Performance

OEE tells you how an asset did. It doesn't tell you about the people running it. Kanoa records who was logged in on each line, and uses that to measure how effective each operator was. This lesson shows you how to review the sessions and read the results.

Review Operator Sessions​

Logging an operator in to an asset records them badging in to the line they're working. It isn't signing in to Kanoa. These sessions are what the OLE / POLE numbers are built from.

  1. On the Asset Operation page, tap the Operators card on the info panel. The Operator Login screen opens as a popup.
  2. Choose the date range of sessions to list.
  3. Read the table: Operator, Asset, Logged In, Logged Out and Duration, with the Total Time under it. An open session shows Still logged in.

You can also open the same screen from Ops → Operations → Operator Login and pick the asset.
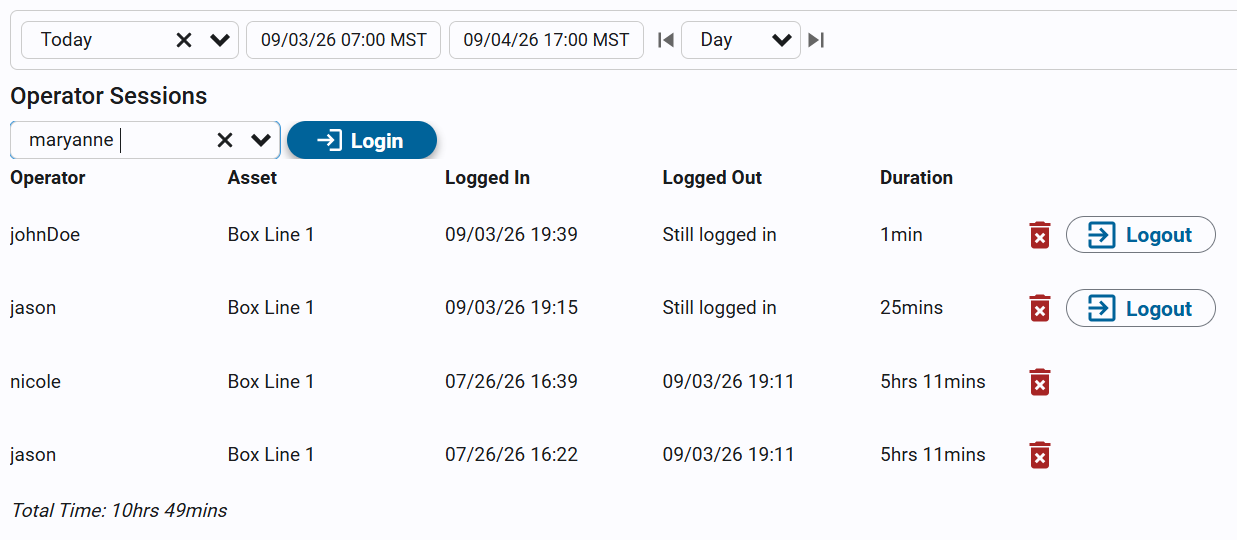
Operator Log In

Log an Operator In or Out​

If an operator forgot to badge in or out, you can fix it.

  1. Open the Operator Login screen for the asset.
  2. In Select Operator..., pick the operator and click Login.
  3. To end a session, click Logout on its row. If an operator is already logged in on another asset, the screen tells you where.
Needs Schedule Operations

Logging operators in and out, and deleting a session, needs a gateway administrator or the Schedule Operations security function. With only Operate Assets or Configure Assets you can see the sessions but not change them. The picker only lists users who have Operate Assets on the asset.

Reference Materials: Operator Login - Sessions, login and logout.

Operator Login​

Logging an operator in to an asset records them badging in to the line they're working; it isn't signing in to Kanoa. The sessions feed the OLE / POLE analysis. Tap the Operators card to open the Operator Login screen as a popup for this asset, without its asset selector:

  • A date selector for the range of sessions to list.
  • Select Operator...: pick a user with Operate Assets on the asset, then click Login. If they are already logged in, here or on another asset, the screen says Currently logged in to that asset and shows Logout instead. The control is shown only on an OEE-enabled asset, to gateway administrators and users with Schedule Operations.
  • A table of the asset's sessions in the range: Operator, Asset, Logged In, Logged Out (Still logged in for an open session) and Duration, with the Total Time under it. For gateway administrators and users with Schedule Operations, an open session has a Logout button and every session a delete button.

Users with only Operate Assets or Configure Assets can open the popup and see the sessions, but not log anyone in or out.


Understand OLE and POLE​

OLE and POLE use the same maths as OEE, but for labor. They differ only in availability.

MetricCounts the operator as available whenAnswers
OLE (Operator Labor Effectiveness)They were logged in.Was the operator there?
POLE (Productive OLE)They were logged in and the asset was running.Was the operator there and was work happening?

The gap between OLE and POLE is time the operator was present but the machine wasn't producing, such as a changeover, waiting for material or downtime. That is why a low POLE with good attendance points to a downtime problem, not a staffing one.

Reference Materials: Calculating OLE / POLE - How availability differs.

Calculating OLE / POLE​

OLE and POLE share the same Performance and Quality factors as OEE. They differ only in how Availability is defined:

MetricAvailability numeratorAnswers
OLE (Operator Labor Effectiveness)loggedInSecs - raw presence"Was the operator logged in, regardless of whether the asset was running?"
POLE (Productive OLE)productiveSecs - logged in and the asset was actually running"Was the operator present and was work actually happening?"
oleAvailability = loggedInSecs / scheduledSecs
poleAvailability = productiveSecs / scheduledSecs
performance = rate achieved vs. standard rate, while productive
quality = yield after waste

ole = oleAvailability * performance * quality
pole = poleAvailability * performance * quality

The gap between oleAvailability and poleAvailability for the same operator/period is itself meaningful: it's time the operator was present but the machine wasn't producing - changeover, waiting on materials, unassigned downtime. This is exposed on the dashboard as the "Labor Gap" KPI tile.

At the per-operator level (spGetOLEData, spGetOLEDataByInterval, spGetOLEDataByShift, spGetOLEOperatorLeaderboard), oleAvailability and poleAvailability share the same scheduledSecs denominator, so poleAvailability can never exceed oleAvailability and Labor Gap is always ≥ 0.

At the whole-asset level (spGetOLEDataAsset, spGetOLEDataAssetByInterval - the dashboard's KPI tiles and trend chart), the two use different denominators (see those procs below), so Labor Gap can go negative. A negative value means the asset kept producing near its normal rate despite fewer scheduled labor-hours actually showing up - understaffed, but currently holding - a distinct signal from the positive case, and the dashboard's Labor Gap tile badges/labels the two differently ("Present, not producing" vs. "Understaffed").

Crew attribution

When more than one operator is logged into the same asset at once, counter output (infeed/outfeed/waste) is split between them via attribution mode, so credit isn't double-counted:

  • EvenSplit (default) - time-weighted share based on how many other operators were concurrently logged in.
  • FullCredit - every concurrent operator gets full credit (e.g. training/shadowing).
  • PrimaryOnly - only the first-logged-in operator at each moment gets performance/quality credit; others still get their own OLE/POLE availability from their own session.

Read the Leaderboard​

  1. Open Ops → Analysis → Operators.
  2. Pick an asset. A line shows that line. An area or site shows everything beneath it, combined.
  3. Pick a date range and an attribution mode.
  4. Read the dashboard.
OLE Dashboard

The dashboard shows:

  • KPI tiles: Attendance, OLE, POLE, Performance, Quality and Labor Gap for the whole selection. Hover a tile for a plain-language explanation.
  • Trend chart: OLE against POLE availability over time.
  • Utilization breakdown: where scheduled time went, split into asset time and labor time.
  • Operator leaderboard: every operator active in the range, ranked by POLE.

Labor Gap can be positive or negative. Positive, labeled Present, not producing, means people were there but the line wasn't running. Negative, labeled Understaffed, means fewer people showed up than were scheduled, but the line is still keeping up.

Pick an Attribution Mode​

When several operators are logged in on one asset at once, Kanoa shares the output between them so credit isn't counted twice.

ModeHow output is creditedUse it for
EvenSplit (default)Shared by time between everyone logged inNormal crew work
FullCreditEveryone gets full creditTraining and shadowing
PrimaryOnlyOnly the first operator logged in gets performance and quality creditOne operator with helpers

Drill Into an Operator​

Click a row in the leaderboard to see that operator's numbers broken down by the individual assets they worked.

warning

Numbers are only fair if the sessions are right. An operator who forgot to log out, or who was never logged in, skews OLE and POLE. Fix the sessions first, then read the leaderboard.

note

Attendance and Labor Gap only mean something if labor was scheduled. Without a schedule, attendance is based on the login sessions alone. Scheduling crews belongs to the Operations Scheduler track.

Reference Materials: Read the Numbers - KPI tiles, trend, utilization and leaderboard.

3. Open the dashboard and read the numbers​

Pick an asset (a single line, or an entire area/site to see everything beneath it combined), a date range, and an attribution mode, and the dashboard shows:

  • KPI tiles - Attendance, OLE, POLE, Performance, Quality, and Labor Gap for the whole selection. Hover any tile for a plain-language explanation of what it's measuring.
  • Trend chart - OLE vs. POLE availability over time, bucketed by hour/day/week (or auto-sized to the range).
  • Utilization breakdown - where scheduled time actually went, split into asset time (productive/downtime) and labor time (logged in/absent).
  • Operator leaderboard - every operator active in the range, ranked by POLE.
Reference Materials: Drill Into an Operator - From a site number to a line.

4. Drill into an operator​

Click any row in the leaderboard to see that operator's numbers broken down by the individual asset(s) they actually worked, instead of one combined figure for the whole site/area. Useful for turning "this operator's POLE is low" into "...specifically because of what happened on Box Line 1, not Case Packer."


Check Your Understanding​

  1. An operator was logged in all shift, but the line was down for two hours. Which is lower, OLE or POLE?
  2. Two operators share one line. Which attribution mode splits the output between them by time?
  3. Which security function lets you log an operator out?
Answers
  1. POLE. It only counts time the operator was logged in and the asset was running.
  2. EvenSplit, the default.
  3. Schedule Operations, or a gateway administrator.