Watch the Floor Live
When you walk in, you want to know which lines are running, which are down, and which need you first. Kanoa shows this live, for every asset you have access to. This lesson shows you where to look, from the whole plant down to one machine.
See Every Asset at Once
The Asset Overview dashboard gives you at-a-glance information on the mode and state of your assets: whether they are in production, faulted or idle. Click any asset to go straight to its Operator Station.

- Click Home, if Asset Overview is your home page. If it isn't, open Dashboards and select Asset Overview.
- Click the > at a site or an area to see its assets as cards.
- Read each asset's card, then click the asset to open it.

Each asset card shows:
| On the card | What it tells you |
|---|---|
| Current Mode and State | The real-time mode and state of the line. |
| Time Ratio Bar | The ratio of time running to unplanned and planned downtime. |
| Order | The current production order and product. |
| Production Count Bar | The count so far against the target count. |
| Total Units and Remaining Units | What has been made, and what is left in the order. |
| Target and Actual Production Rates | The rate you should be at and the rate you are at. |
| Production Order Indicators | Whether you are over, under the target rate, or on track. |
| OEE Score | OEE, with its availability, performance and quality. |
| 12 Hour OEE Bar Graph | The last 12 hours of OEE. Hover for exact values and times. |
The Area Summary tab rolls the same numbers up by area.

Reference Materials: Enterprise Overview - The asset card and the Area Summary.
The Asset Overview dashboard (System Dashboards\Asset Overview) gives you at-a-glance information about the current mode and state of your assets: whether they are in production, faulted or idle. It can be your home page: open it, click the three dots at the top right and select Make Default. Home then opens it.
You can click on any asset to go directly to the Operator Station.
Click on the > at the Site or area level to get more detailed information about your assets.
The asset card shows more detailed information such as ...
- Current Mode and State: Shows the real-time mode and state of the line
- Time Ratio Bar: Illustrates the ratio of time running to unplanned downtime and planned downtime
- Time In State: Displays the runtime and total downtime for the current production order.
- Order: Indicates the current production order and the product
- Production Count Bar: Shows the current production count relative to the target count
- Total Units and Remaining Units: Number of units produced and units remaining in the current order
- Target and Actual Production Rates: Displays both target and actual rates per the production order
- Production Order Indicators: Alerts if overproduction or under the target rate occurs, or if production is on track.
- OEE Score: Displays the Overall Equipment Effectiveness score for the asset
- Availability, Performance, and Quality Metrics: Shows these metrics for the current production order
- 12 Hour OEE Bar Graph: A bar graph depicting the last 12 hours of OEE values with tooltips on hover showing exact values and timestamps.
The Area Summary tab rolls up the performance data to provide an aggregated value by area.
Open the Asset Operation Page
The Asset Operation page is the operator's screen, and you can read it too. Open it by clicking an asset on the overview, or from Ops → Operations → Asset Operation.
When you select a site, area or line that is not itself an OEE asset, the page shows a card for each asset under it. Tap a card to step down. Up to parent goes back a level. You only see assets you have access to.
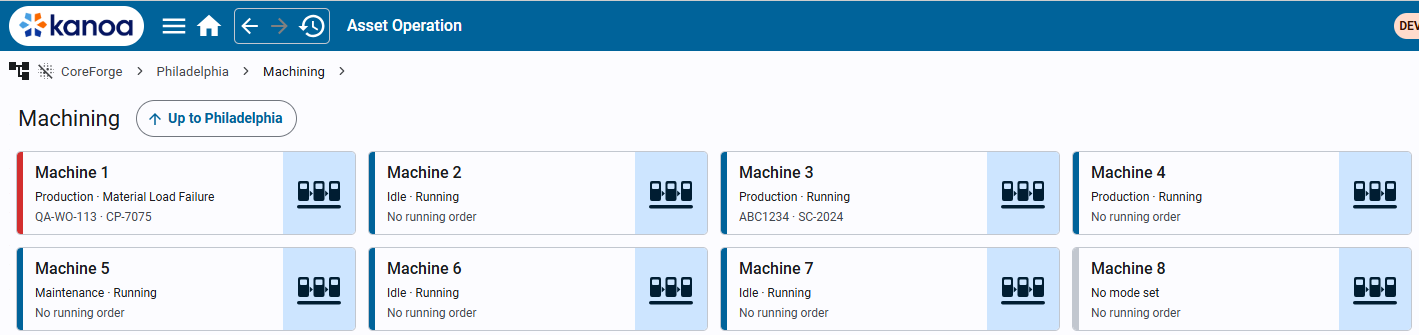
Read each card like this:
- The stripe is the colour of the asset's current state, as on the overview.
- The second line is its mode and state, such as Production · Running.
- The third line is the running production order and item, or No running order.
Tap an OEE asset's card to open it.
Read One Machine
On a machine, the info panel on the left shows the machine as a stack of cards. The ones you check most are:
- State: running or down, and for how long.
- Speed loss: shown only while the machine runs below its standard rate.
- Notifications: uncoded downtime, quality checks coming due or missed, measures out of control and tooling alerts. Its stripe is orange for any, and red for urgent ones.
- Operators: who is logged in on the machine.
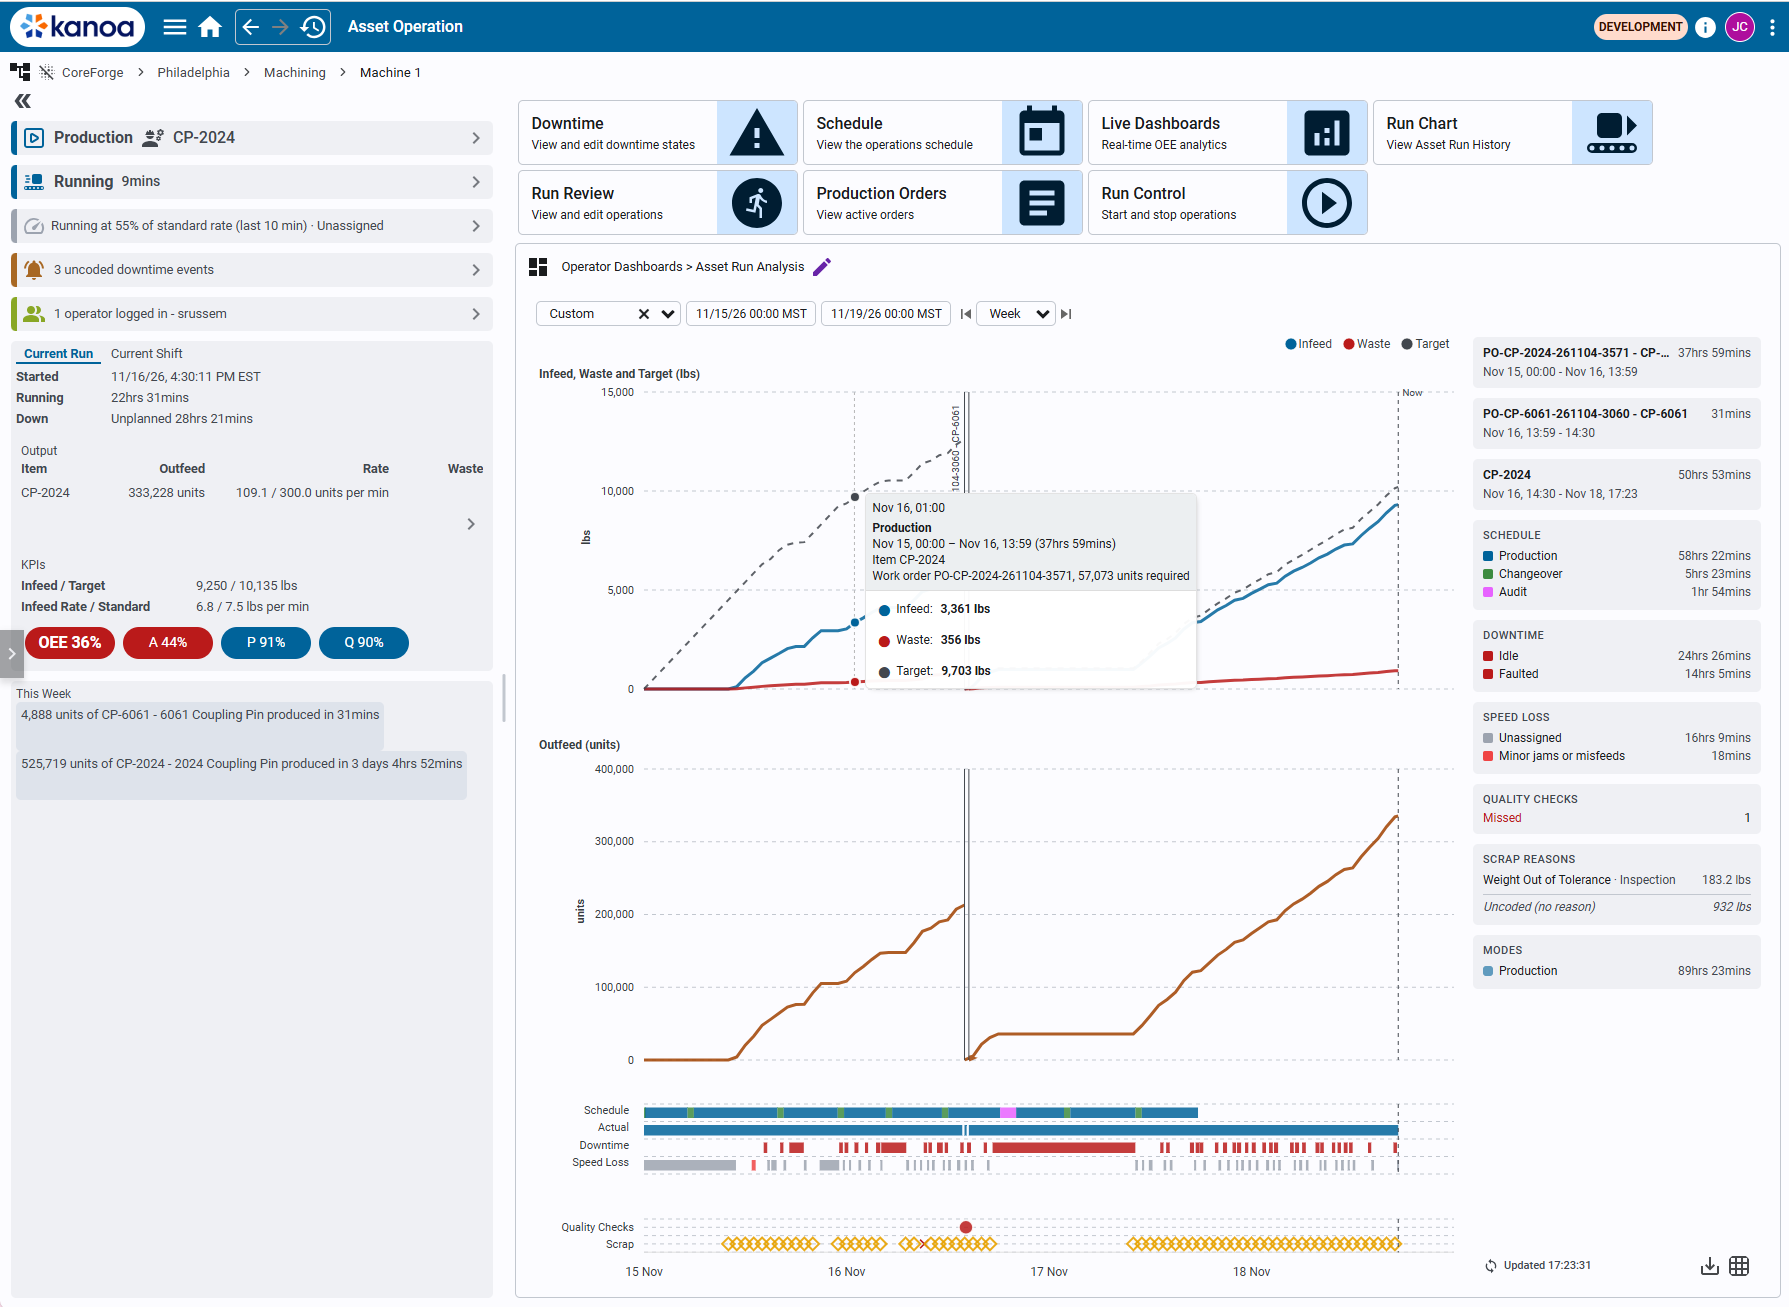
Under the cards, the Current Shift tab shows the shift so far: Started, Running and Down, the Output, and the KPIs with OEE. The Current Run tab shows the same for the run now.
A chevron (›) on a card means you can tap it to change it. Without the security function, the card only shows.
Reference Materials: The Info Panel - Every card, what it shows and what it opens.
The Info Panel
Each card has a coloured stripe on its left. A chevron (›) means you can tap the card to change it; without the security function, the card only shows.
- Mode: Whether the asset is in production or idle, and the item and order running. Tap to open Run Control to start or end a run, or change the mode. Needs Operate Assets user function.
- State: the current state, such as Running or Waiting on parts, and how long it has lasted. Tap to set the state. Needs Operate Assets user function.
- Speed loss: shown while the asset runs below its standard rate, with how far below and why. Tap to set the reason. See Speed Loss. Needs Edit Operations user function.
- Tooling: on a machine that uses tooling, the mounted tool and how close it is to its next limit. Orange when maintenance is due, red when over a limit. Tap to mount or unmount tools. See Mounting Tools. Needs Operate Assets or Configure Assets user function.
- Notifications: uncoded downtime, quality checks coming due or missed, measures out of control and tooling alerts. Orange with any, red for urgent ones. Tap to open the list. Open to everyone.
- Operators: who is logged in on the asset. Tap to see the sessions and, with Schedule Operations, log operators in and out. See Operator Login. Needs Operate Assets or Configure Assets user function.
Under the cards, the Current Run and Current Shift tabs show the run or the shift so far:
- Shift (Current Shift tab): the shift and its times. No Shift Defined is a time with no shift scheduled.
- Started, Running and Down. A shift's times are in the asset's time zone; a run's start is in your device's.
- Output: each item's outfeed, rate and waste. A family tool's other items show as co-products. With Edit Operations, the chevron opens the Count Editor for the run or the shift.
- KPIs: infeed against the target, the actual against the standard rate, and OEE with its availability, performance and quality.
This Week lists what the asset has made this week.
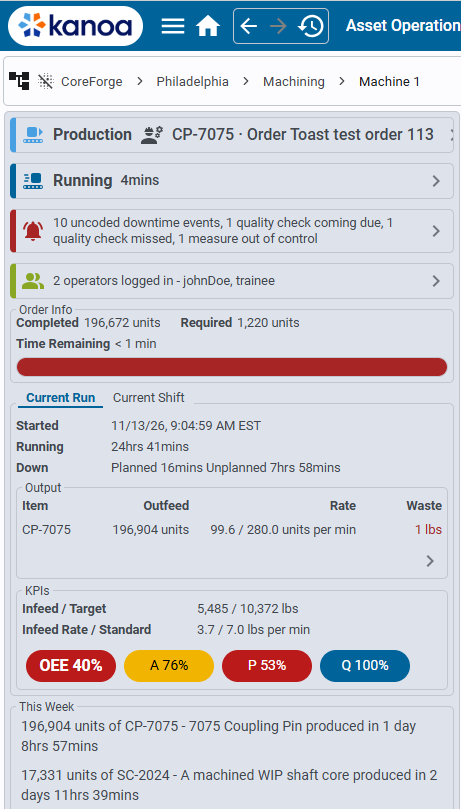
Operator Login
Logging an operator in to an asset records them badging in to the line they're working; it isn't signing in to Kanoa. The sessions feed the OLE / POLE analysis. Tap the Operators card to open the Operator Login screen as a popup for this asset, without its asset selector:
- A date selector for the range of sessions to list.
- Select Operator...: pick a user with Operate Assets on the asset, then click Login. If they are already logged in, here or on another asset, the screen says Currently logged in to that asset and shows Logout instead. The control is shown only on an OEE-enabled asset, to gateway administrators and users with Schedule Operations.
- A table of the asset's sessions in the range: Operator, Asset, Logged In, Logged Out (Still logged in for an open session) and Duration, with the Total Time under it. For gateway administrators and users with Schedule Operations, an open session has a Logout button and every session a delete button.
Users with only Operate Assets or Configure Assets can open the popup and see the sessions, but not log anyone in or out.
Reference Materials: Choosing an Asset - Step down from site to machine.
Choosing an Asset
Asset Operation runs one OEE asset at a time. When the asset selected in the breadcrumb is an enterprise, site, area or line that isn't OEE-enabled, the screen shows a card for each asset under it, so you can step down to the machine you want.
- Tap an OEE asset's card to select it: the screen shows its operations, info panel and dashboard.
- Tap any other card to show the assets under it. Up to parent next to the heading goes back a level, as does the breadcrumb.
- Only the assets you have access to are shown. An asset that isn't OEE-enabled and has nothing under it is left out, since there is nothing to choose there.
The text on the cards is shown in the session's language.
kanoaTablet starts on the same cards: the enterprises you have access to, with no heading. Step down to a machine and tap it to open its Asset Operation page; inside an enterprise, Up to all enterprises goes back to the start.
| On the card | Shows |
|---|---|
| Stripe | For an OEE asset, the colour of its current state, as on the Asset Overview dashboard (grey with no mode set). For one you can step into, the primary colour. |
| Name | The asset's name. |
| Second line | For an OEE asset: its mode and state, such as Production · Running. For an enterprise, site, area or line: its type and how many assets are under it, such as Area · 8 assets, with a chevron (›). |
| Third line | For an OEE asset: the running production order and item, or No running order. |
| Icon | The asset's icon. |
Know What the Marquees Show
A marquee is a set of dashboards that rotate on a TV in the plant. You may know it as an Andon or a visual display. It needs no one to touch it.

As an operations supervisor, you look at it rather than run it. Each TV is registered as a display and shows the marquee assigned to it, which can be a single dashboard for a static view. If no marquee is assigned to the TV, it shows the default dashboard. Whoever manages displays chooses the marquee and theme in the Marquee Editor (Dashboards → Marquee Editor), and the TV updates straight away.
Reference Materials: Marquees - Rotating dashboards for TVs on the floor.
We call them Marquees, but you may know them as Andon or Visual Display Management systems. Whatever you call them, we have provided a rather simple method of providing a set of rotating dashboards to TV screens located throughout your plants.
As part of the default install, you should have received a project called kanoaMarquee. This project contains nothing more than a page through which we can pass parameters back to the marqueeDisplay view to indicate where this marquee is to be displayed. We could have added this page to the kanoaMES project, but its likely that you'll want to configure the project to not have security and to automatically update whenever changes are made in the designer.

The page url consists of /marquee/display/:siteCode/:location/:screenName which allows us to send the site, location at the site and tv screen identifiers.
For a giant TV mounted say in your Texas site, in the breakroom, you would create a startup shortcut on the TV embedded PC to open a browser or a Perspective workstation to
http://demo.kanoa.ai/data/perspective/client/kanoaMarquee/marquee/display/Texas/Break%20Room/TV4
You'll need to change the demo.kanoa.ai to point to your gateway.
The Marquee Display Editor
Whenever a TV or device opens a browser to the gateway marquee display, that device is registered as a marquee display device. In the Marquee Editor screen, you can now configure which marquee is to be displayed on that device and what theme to set. All changes are immediately updated on the device. All configuration for your TVs and devices throughout your plant can be configured centrally from the kanoaMES application with no need to change anything on the device itself.

If no marquees are configured for the device, the default dashboard will be displayed. If you only want to show a static display on a tv, simply create a marquee with a single dashboard.
The Marquee Editor
A marquee consists of an ordered list of dashboards with how long they should be displayed for.

It really is as simple of that. Create your widgets, create your dashboards, create your marquees and point your tvs to the kanoaMarquee project.
Check Your Understanding
- You want to see which lines in the Machining area are running. Where do you look?
- A machine's Notifications card has a red stripe. What does that mean?
- A TV on the floor shows the default dashboard. What does that tell you?
Answers
- The Asset Operation page cards for the area, or the asset cards on the overview. The stripe and the second line show each asset's mode and state.
- Something urgent needs attention. Tap the card to see the list.
- No marquee is assigned to that TV. Whoever manages displays assigns one in the Marquee Editor.