Find Lost Time
A machine loses time in two ways: it stops, or it runs slower than it should. Kanoa records both, and the reason an operator gave is what turns a number into something you can fix. This lesson shows you how to find the biggest losses and the ones nobody has explained yet.
Read Downtime for One Asset
Kanoa has a ready-made Downtime analysis page. It looks at one asset at a time, so pick a line or a cell it has collected data for.
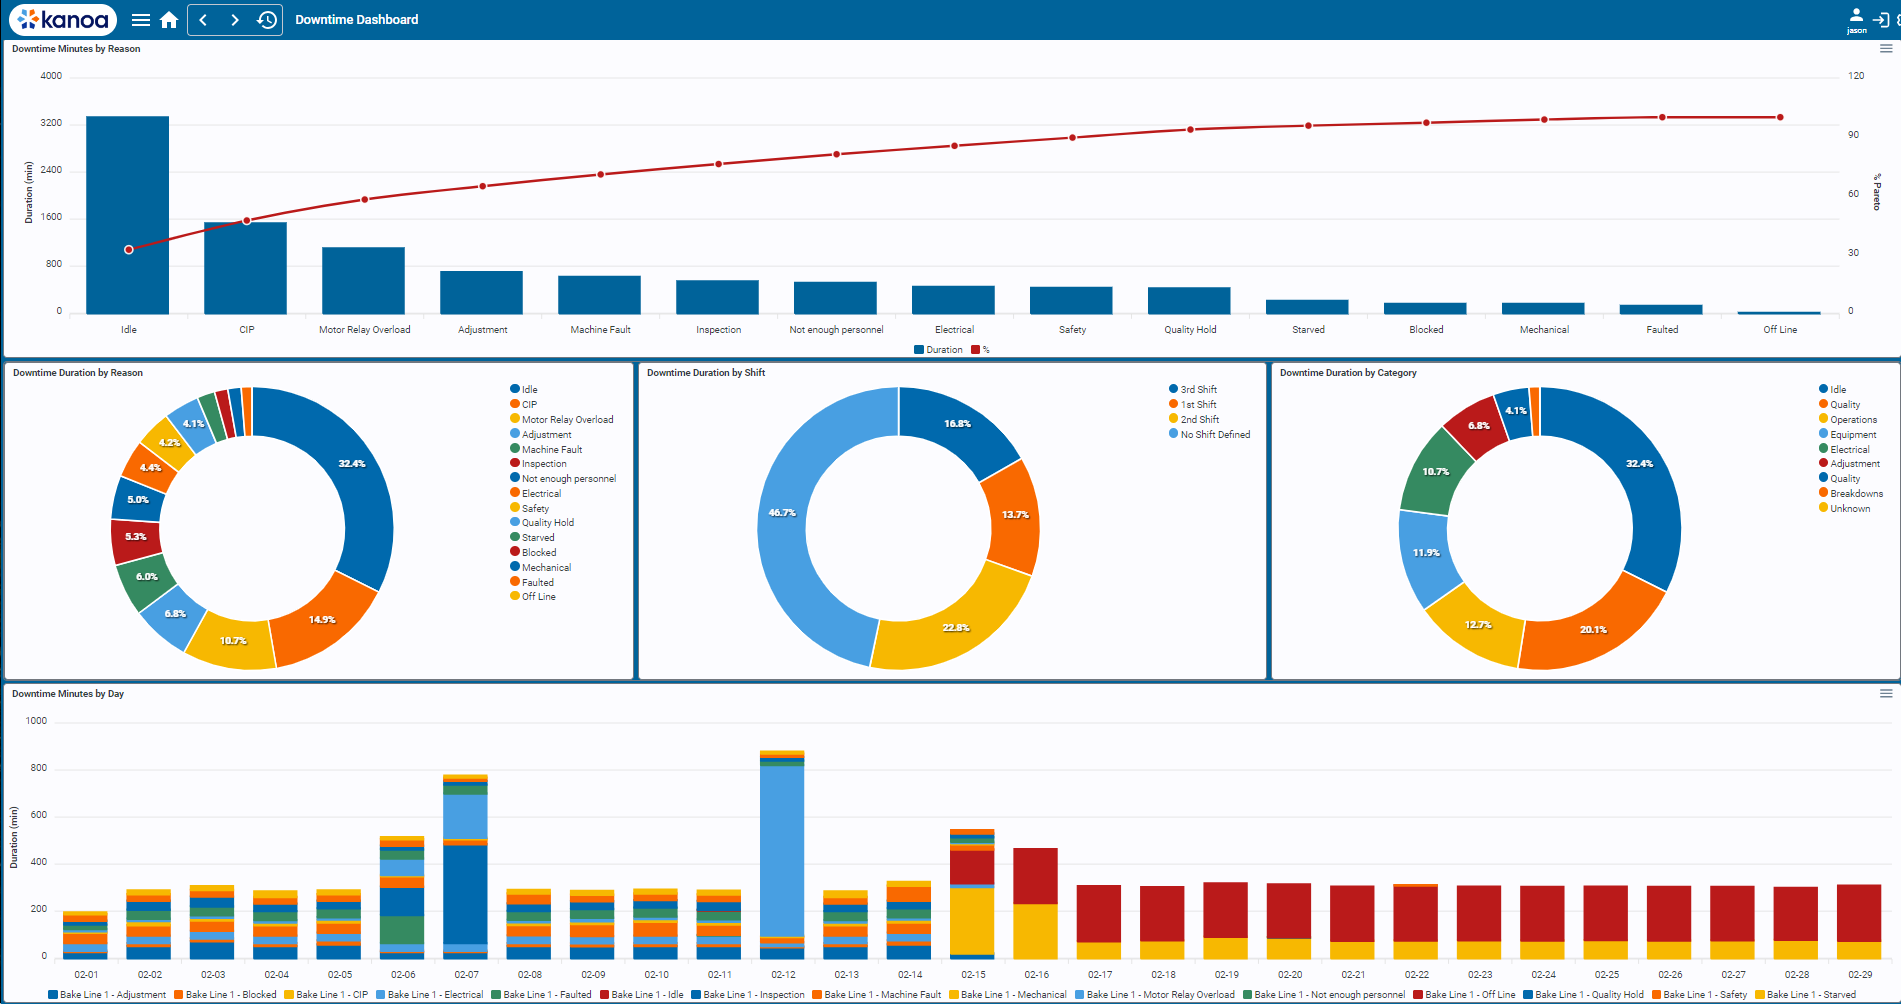
- Open Ops → Analysis → Downtime.
- Click the asset selector and choose an OEE asset, such as Machine 1.
- Choose a date range, such as Yesterday, or set a custom range.
- If you only want the long stops, set the Duration Filter to a number of minutes.
- To focus on the worst, set the Top Downtime Filter to show only the top N states or reasons.

Find the Top Reasons
The page has several charts, each a different view of the same data.
| Chart | Use it to |
|---|---|
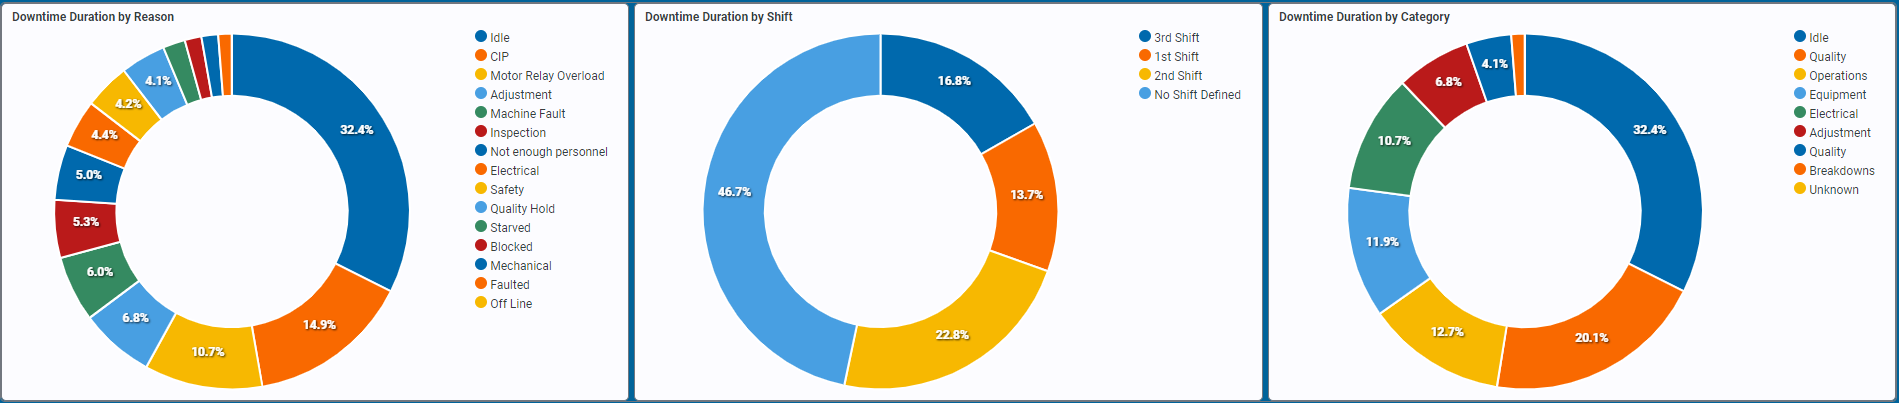
| Downtime By Category | See which category affects you most, such as maintenance or personnel. The pareto line marks the 80/20 breakpoint. |
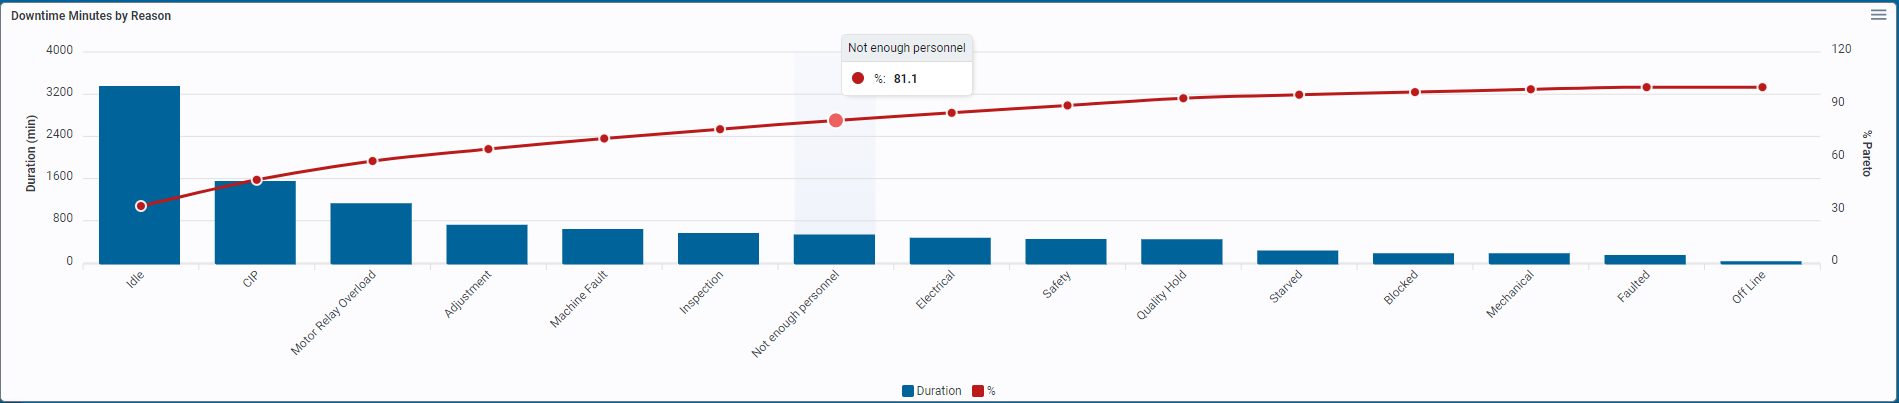
| Downtime By Reason | See the specific reasons the asset was not producing. |
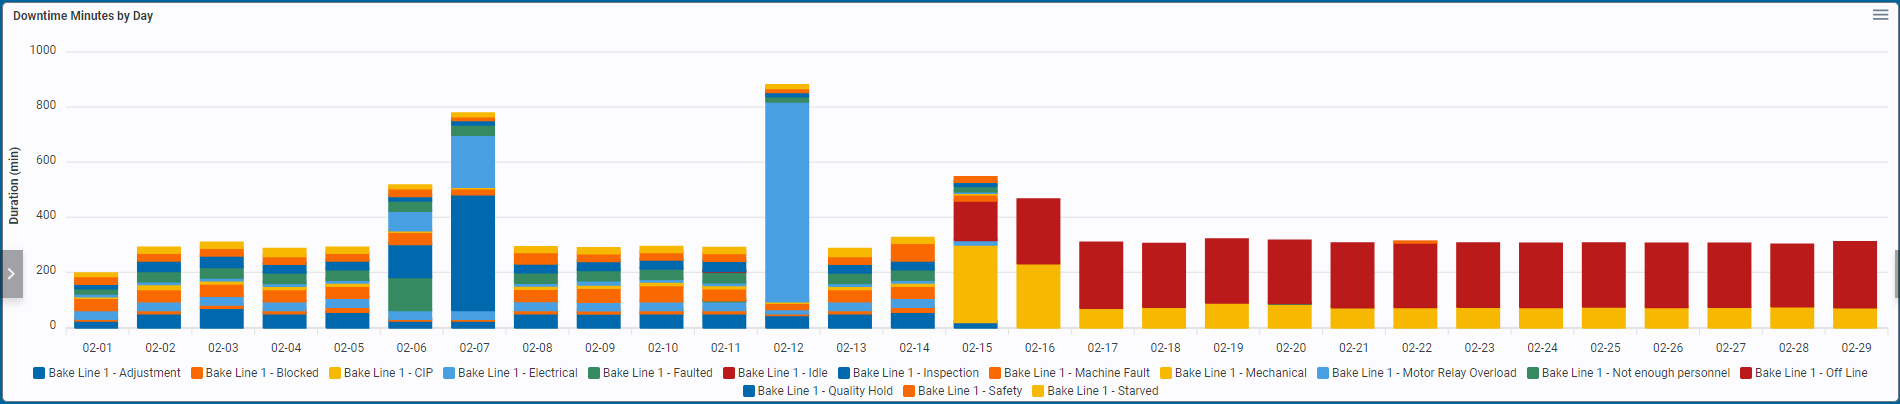
| Downtime By Day | Find a bad day. Each day is stacked by reason. |
| Downtime By Pie | See category and reason as pies, plus downtime by shift. |
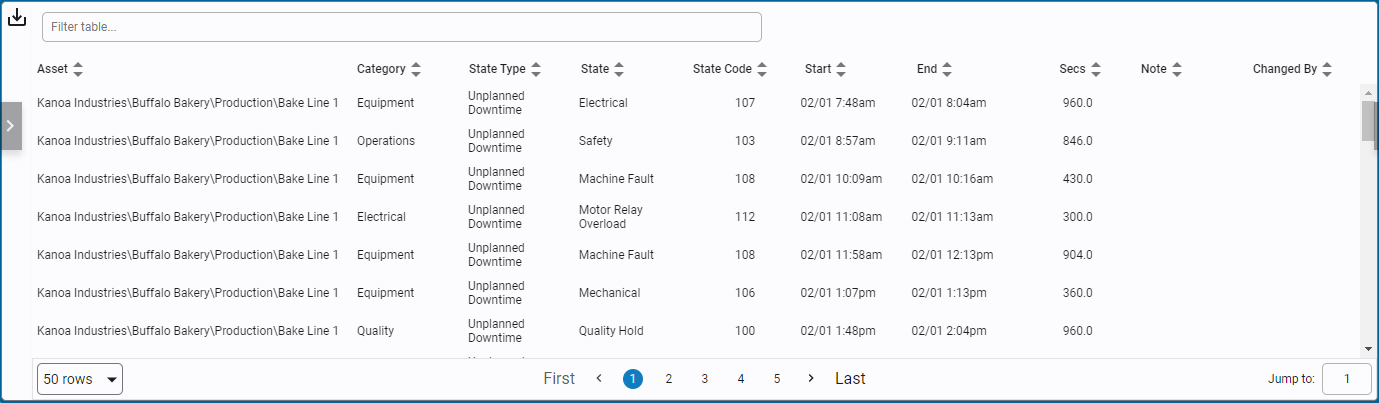
| Downtime Table | See the raw events. Export them to Excel. |
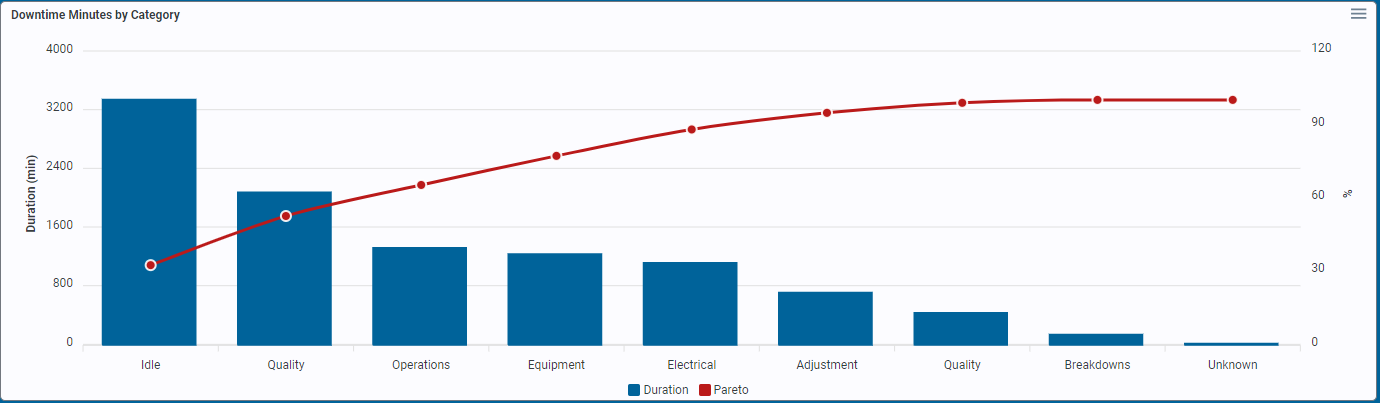
Start with Downtime By Category, then open Downtime By Reason for the category at the top. Downtime outside any scheduled shift is grouped under no Shift defined in the shift pie.
Reference Materials: Downtime Filters - Asset, date range, duration and top downtime.
Filters
We're looking at a lot of downtime data in different ways on this page, so we've limited it to one at asset at a time. You can change that if you like for your application, but for a 30,000ft view of downtime and utilization across all assets within your enterprise, may we recommend the Loss Analysis page.
- Asset Selector: Click on the asset selector
 to choose the desired 'OEE_Enabled' asset (this needs to be a line or cell that we have been collecting data for).
- Date Range Selector: Select from our pre-defined list of time periods such as 'Today', 'Yesterday', 'Last Week', 'This Month', 'Last Month', 'Year To Date' or select a custom range.
- Duration Filter: Filter out downtimes shorter than a specified duration (in minutes).
- Top Downtime Filter: Limit to just show the top 'N' distinct downtime states or reasons.
Downtime By Category Chart
Each downtime state can be configured to belong to a certain category. This way you can group certain states to be
say 'maintenance', 'quality', 'equipment', 'personnel' related. figure out which category of downtime affects your operations the most.
The pareto line indicates the 80/20 breakpoint.
Downtime By Reason Chart
All possible reasons (states) why an asset may be down are displayed in this chart. A reason may be unplanned or planned, but either way it caused the asset not to be running during a production run. Use this chart to identify specific reasons why your asset is not producing.
Downtime By Day
Looking for trouble on a particular day? This chart stacks all the different downtime reasons that occurred on each day.
Downtime By Pie
A trio of pie charts show downtime by category and reason in a slightly different way and also throws in a 'Downtime By Shift' pie. If downtime occurred outside of any scheduled shift, it will be thrown into a 'no Shift defined' bucket.
Downtime Table
It doesn't really matter how we organize or display all the downtime, someones going to want to see the data in a different way.
So we've provided a table view of the raw data that can be exported  and thrown into Excel. Pivot away!
Compare Losses Across a Site
The downtime page is one asset at a time. To compare a whole line, area or site, open Loss Analysis from Ops → Analysis → Loss Analysis. It shows every loss in minutes, so downtime, slow running and scrap can be compared directly.
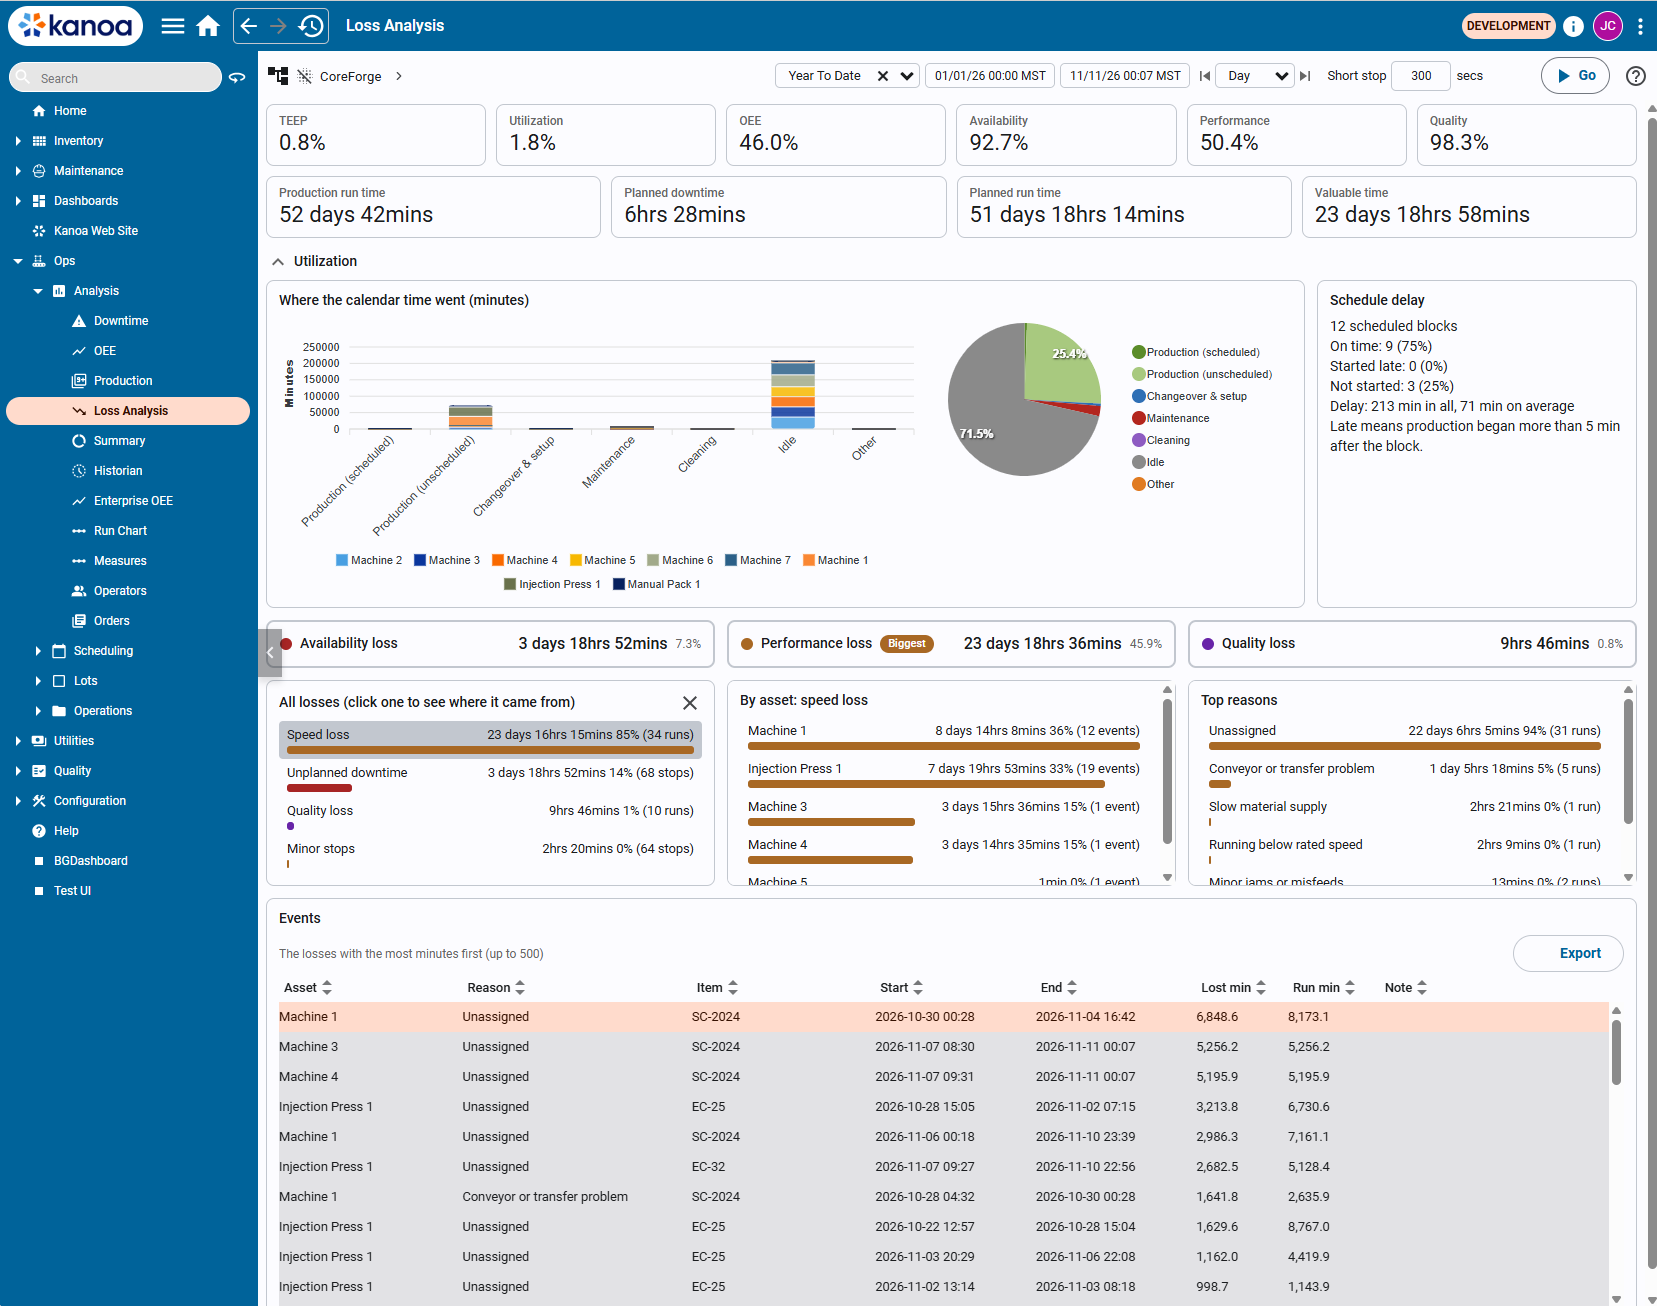
- Choose an Asset. Pick a site and every OEE asset under it is included.
- Choose a Date range, then press Go.
- Read the three loss cards: availability, performance and quality loss in minutes. The biggest is marked.
- Click a card to see only that loss. By asset shows which assets lost the most.
- Read Top reasons to see why. Click the x to go back.
Loss that no reason covers shows as Unassigned. That includes automatic speed-loss events nobody has explained yet.
Events lists the events behind the selected loss, with the most minutes first. Export saves them to Excel.
Read Speed Loss
When a machine runs below 95% of its standard rate for 5 minutes, Kanoa opens a speed-loss event on its run, and the operator can give it a reason from the info panel. The event starts as Unassigned.
Those events show in two places:
- The Speed Loss row of the timeline on the Asset Run Analysis dashboard, in each reason's colour.
- Ops → Operations → Performance Events, where an event still Unassigned counts as loss to explain, not as coded loss.
Performance events only cover slow running. Time the machine was stopped is downtime, and is tracked separately.
Reference Materials: The Speed-Loss Event - When one opens, what it counts and how it ends.
The Speed-Loss Event
When a machine turns slow, a performance event opens on its run:
- It starts at the first of those 5 minutes and stays active (no end yet) while the machine is slow. Reports and widgets count an active event up to now.
- Its value is the minutes of output lost so far: the minutes running, minus what was made divided by the standard rate per minute. It's updated every minute.
- It ends when the rate has been back above 95% for 5 minutes (it ends where the recovery started), when a new run starts (it ends at the new run's start), or when the machine stops running. Downtime is an availability loss, not a speed loss.
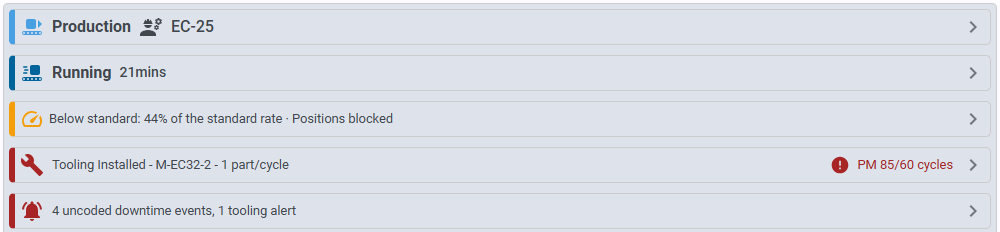
- Its reason starts as Unassigned (reason class Speed Loss), or Positions blocked (class Tooling) while a position of the mounted tool is blocked. These are chosen by the system and can change while the event is open.
Give a Slow Run a Reason
If the operator didn't, you can code the lost minutes yourself.
- Open Ops → Operations → Performance Events.
- Select the asset and a date range, and run the report.
- Find the row with uncoded lost minutes. Each row shows the runtime, the expected and actual infeed, and the lost minutes.
- Select the row and click the add button.
- Pick a Reason Code, add a note if it helps, and save. The event moves from Uncoded to Coded.
You can split the lost minutes across several reasons when more than one thing slowed the line.
Reference Materials: Coding a Performance Event - Reason codes and lost minutes.
Coding a Performance Event
Performance Events can be added via the Performance Event editor.
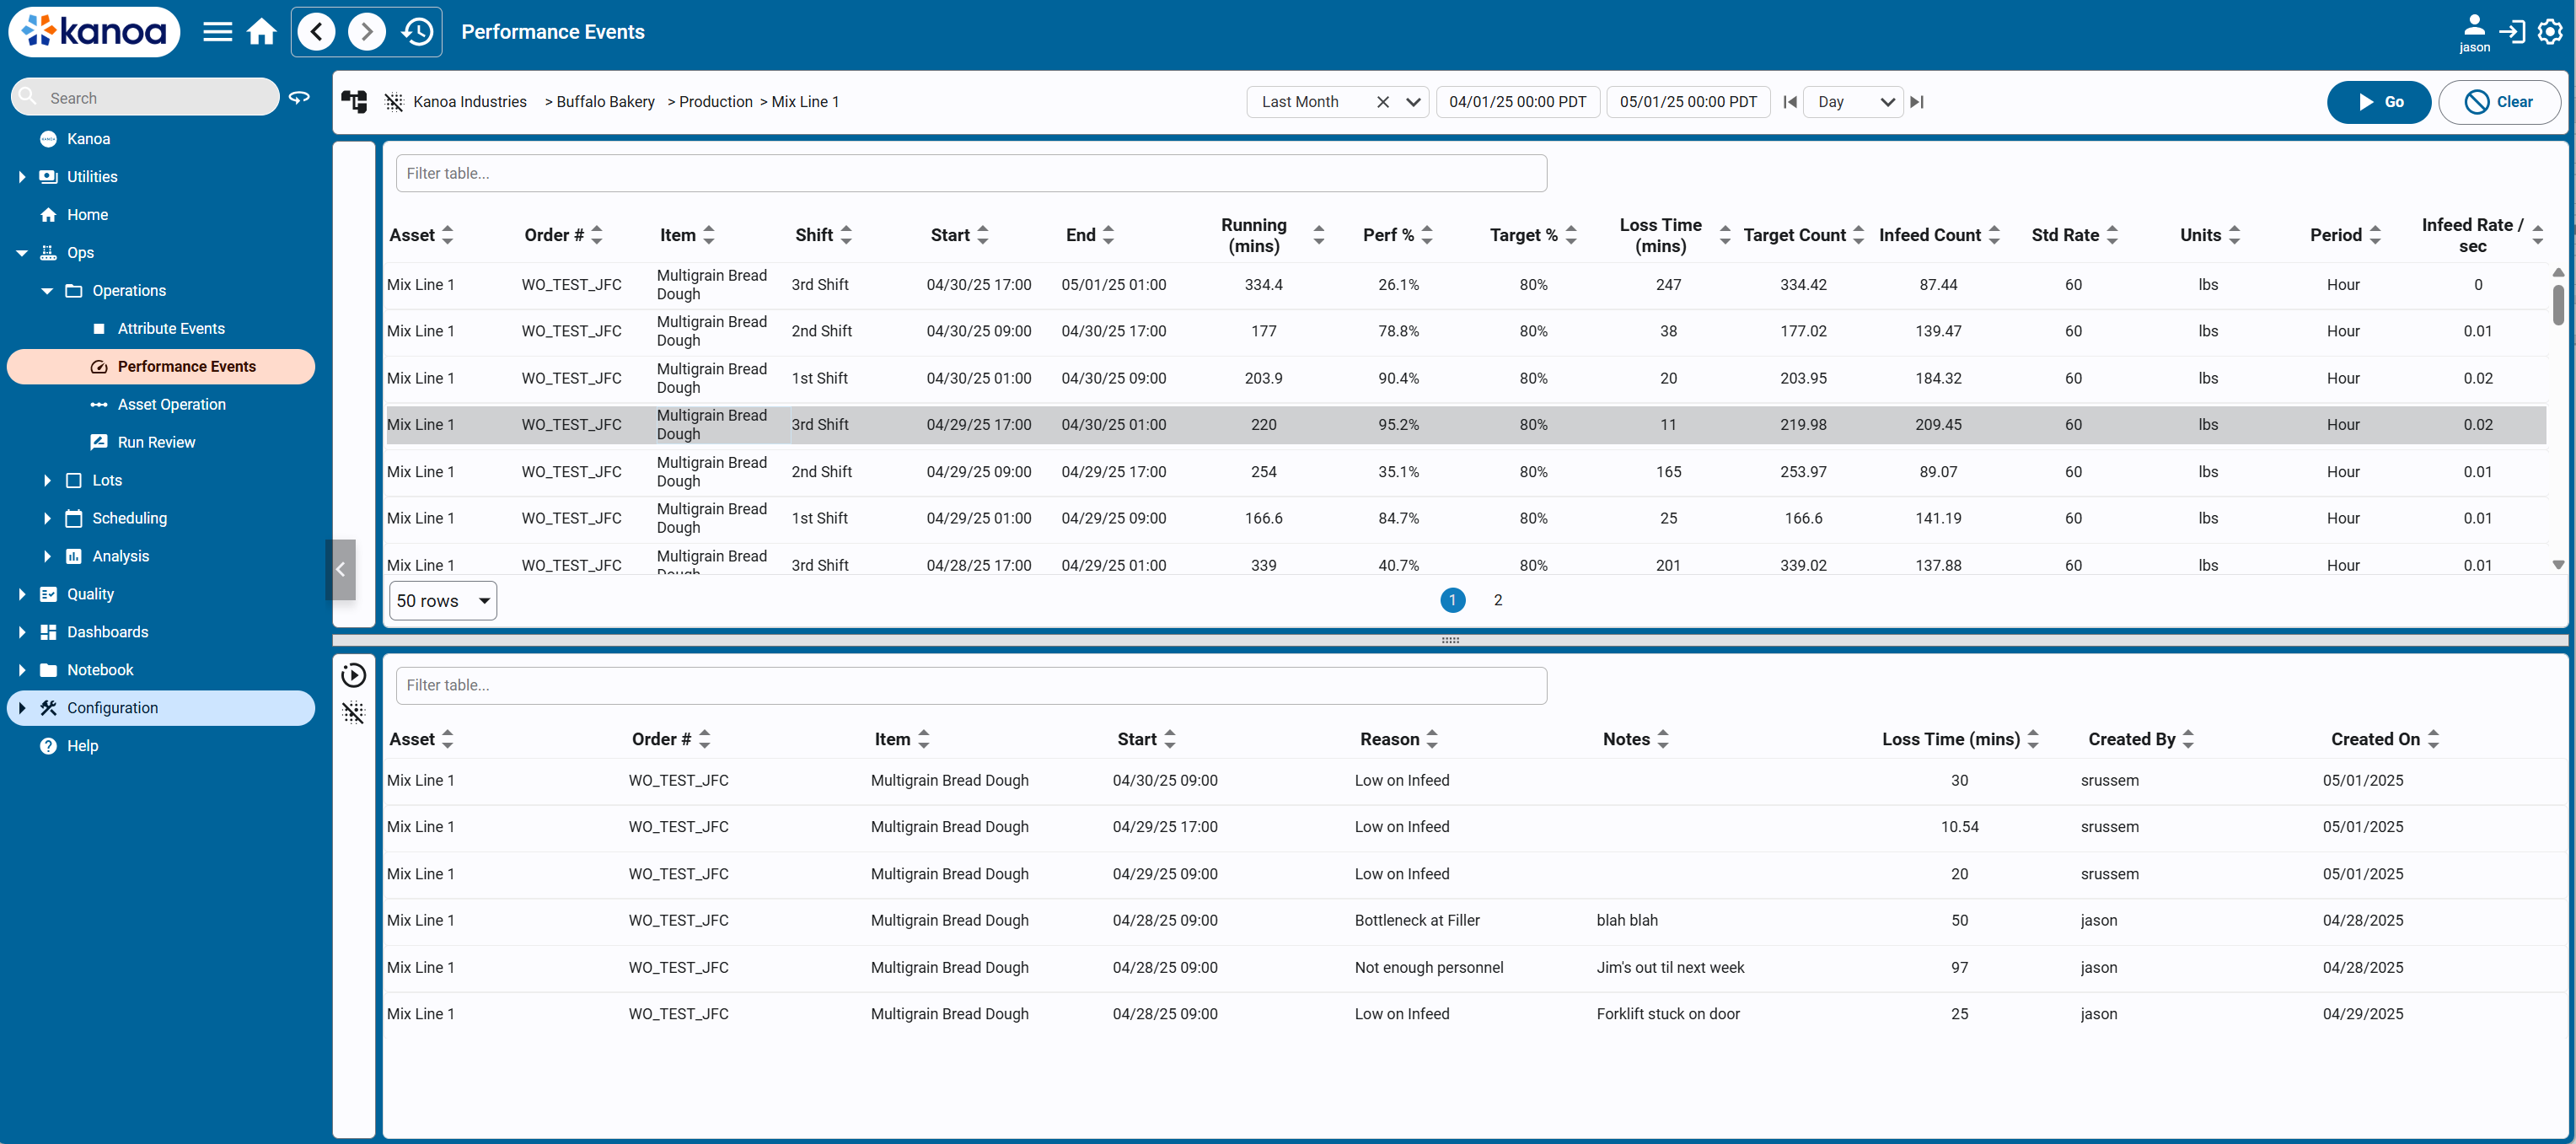
- Open the Performance Events panel for the run.
- Locate the event with uncoded Lost Minutes.
- Select a Reason Code from the list (e.g. Material Jam, Operator Adjustment, Changeover, Quality Check).
- Optionally add a note with more detail.
- Save. The event moves from Uncoded to Coded.
Code events as soon as possible after they occur — the details are freshest and easier to remember accurately.
Example
- Runtime: 60 minutes
- Target speed implies an Expected Infeed of 6,000 units
- Actual Infeed: 5,400 units
- Result: 6 Lost Minutes (equivalent time to produce the missing 600 units)
This 6-minute event now appears in the queue for you to code — for example, "Reason: Material Jam — cleared at 2:15 PM."
Check Your Understanding
- You want to know which category of downtime costs Machine 1 the most. Which chart do you start with?
- How do you compare downtime, slow running and scrap across a whole site?
- A speed-loss event's reason is Unassigned. What does that mean for your reports?
Answers
- Downtime By Category, then Downtime By Reason for the top category.
- Open Loss Analysis, pick the site, press Go and read the three loss cards and Top reasons.
- It still counts as loss to explain, not as coded loss. Someone needs to give it a real reason.