Backlog and Labor
- In Maintenance → Maintenance Analytics, find the Work Order Flow chart: created, completed and open work orders over time.
- Find Backlog Aging: open work orders grouped by how long they've been open (0–7, 8–30, 31–60 and 60+ days).
- Switch to the stacked view, segmented by maintenance type and then by priority.
| If you see | It means |
|---|---|
| Created higher than completed | The backlog is growing |
| Completed higher than created | The backlog is shrinking |
| Preventive work aging in the stacked view | PM is being deferred to fight fires |
| High-priority work in the older buckets | Urgent work is being neglected |
- Find the Labor Hours KPIs: technician hours, procedure step hours, their total, average time active, and average time to complete.
- Look at Labor Hours by Technician. Both you and
technicianappear, from the coolant leak work order. - In the Maintenance Work Order Hours table, find the coolant leak and the weekly PM, and compare their logged hours with their total and active durations.
Logged labor and elapsed time are reported separately on purpose. A work order that's been open for days with only an hour logged is waiting, not being worked, which is exactly what this comparison shows.
Reference Materials: Maintenance Analytics
Kanoa Maintenance includes built-in KPI to provide a complete view of maintenance performance:
- MTTA → How fast work is acknowledged
- MTTR → How fast work is completed
- MTBF → How reliable assets are
- Backlog Aging → How healthy the backlog is
- Work Order Flow → Whether workload is increasing or decreasing
- Labor Hours → Where technician and procedure time is actually going
Together, they enable teams to move from reactive maintenance to data-driven, proactive operations.

MTTA (Mean Time to Acknowledge)
Created → First Response
MTTA reflects the responsiveness of the maintenance team and how quickly work begins after being requested.
Use MTTA to :
- Evaluate dispatching efficiency
- Identify delays in work assignment
- Ensure critical work is acknowledged quickly
MTTR (Mean Time to Repair)
Measures how long it takes to complete a work order once work has started.
Start → Completed
MTTR reflects execution efficiency and how quickly maintenance issues are resolved.
Use MTTR to:
- Identify slow or complex repairs
- Monitor technician performance
- Detect process inefficiencies or bottlenecks
MTBF (Mean Time Between Failures)
Measures the average time between failure events for an asset. MTBF is a key indicator of asset reliability and operational stability.
Use MTBF to:
- Identify unreliable equipment
- Prioritize maintenance improvements
- Track effectiveness of preventive maintenance
Schedule Compliance
Measures how consistently maintenance work is completed on or before its scheduled due date.
Schedule Compliance (%) = Work Orders Completed On Time / Total Work Orders Completed
Labor Hours
Labor Hours brings the technician time logged via Technician & Labor Tracking into the Analytics dashboard, alongside procedure step time and how long work orders actually spend open:
- Technician Hours → total time technicians logged against work order events
- Procedure Step Hours → total time logged completing procedure steps
- Total Labor Hours → Technician Hours + Procedure Step Hours
- Avg Time Active → average time work orders spent in the 'In Progress' status
- Avg Time To Complete → average time from creation to completion
Total Labor Hours = Technician Hours + Procedure Step Hours
Technician Hours and Procedure Step Hours are reported separately from Avg Time Active / Avg Time To Complete rather than combined - one measures labor actually logged, the other measures wall-clock elapsed time, and a work order can accrue plenty of one without much of the other.
Use Labor Hours to:
- See how much of total maintenance time is hands-on technician work versus procedure execution
- Compare logged labor against elapsed time to spot work orders that sit open without much work happening
- Benchmark labor investment across a date range or asset scope
Labor Hours by Technician
A bar chart of the top 10 technicians by hours logged in the selected period.
Use this to:
- See workload distribution across the maintenance team
- Identify technicians carrying a disproportionate share of the work
- Support staffing and scheduling decisions
Maintenance Work Order Hours
A record-level table listing every work order with logged technician or procedure time in the period, so the summary KPIs above can be traced back to individual work orders:
Work Order, Title, Asset, Technicians (distinct people logged), Technician Hrs, Procedure Step Hrs, Total Duration (hrs), Active Duration (hrs)
Use this table to drill into a specific work order behind an unusual Labor Hours number, or to export detail for a date range.
Work Order Flow
The Work Order Flow chart tracks maintenance activity over time, showing:
- Created work orders
- Completed work orders
- Open work orders (backlog)
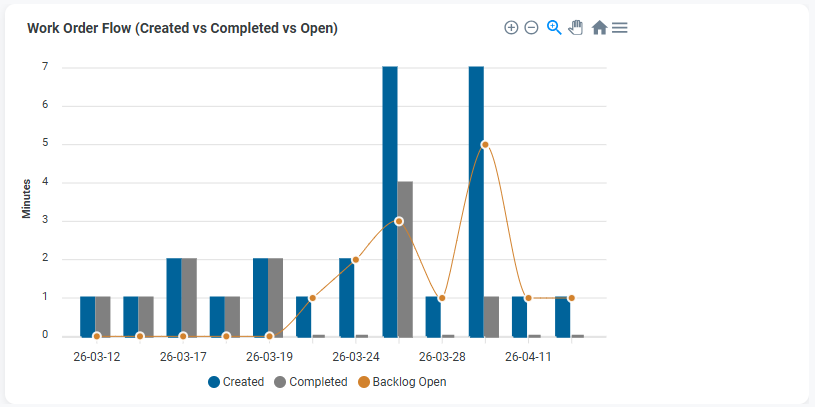
This helps determine whether maintenance operations are keeping up with demand.
Interpretation:
Created > Completed → backlog is growing
Completed > Created → backlog is shrinking
Backlog Aging
Backlog Aging shows how long open work orders have been active, grouped into time-based buckets:
0–7 days 8–30 days 31–60 days 60+ days
This provides visibility into backlog health and highlights work that may be delayed or neglected.
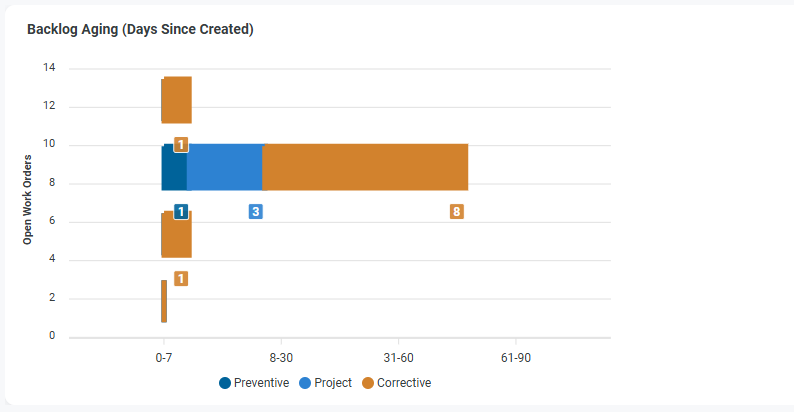
Use Backlog Aging to:
- Identify stale or overdue work
- Monitor workload distribution
- Detect capacity or prioritization issues
Backlog Aging (Stacked)
Backlog Aging can be further segmented by:
- Maintenance Type (e.g., Preventive, Reactive)
- Priority (e.g., Low, Medium, High, Critical)
This stacked view helps answer What type of work is aging?
Use this to:
- Identify whether preventive work is being deferred
- Detect buildup of reactive maintenance
- Highlight aging high-priority work
MTTR / MTTA Trend
Displays MTTR and MTTA over time to visualize trends in response and repair performance.
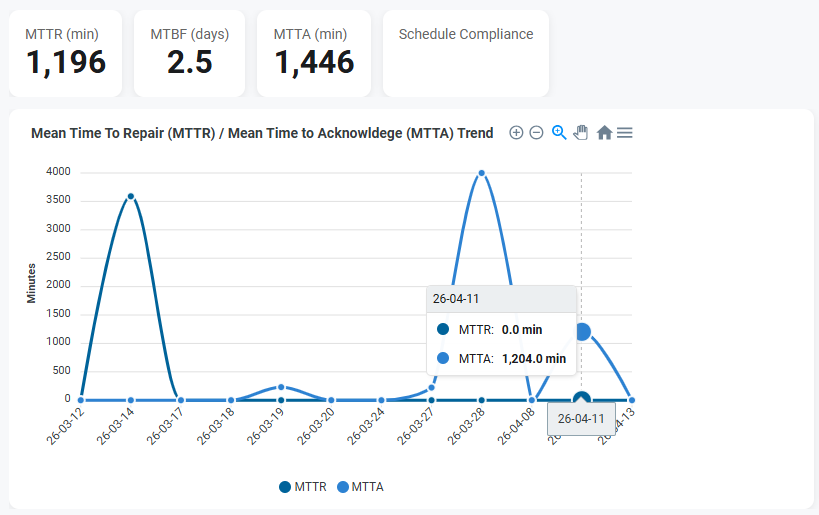
This helps identify:
- Performance spikes or anomalies
- Periods of delayed response or repair
- Trends in operational efficiency
Workflow Churn
Workflow Churn tracks how often work orders transition between states (e.g., Open → In Progress → Open).

High churn may indicate:
- Rework
- Poor planning or unclear requirements
- Frequent interruptions or reassignment
MTBF by Asset
Displays Mean Time Between Failures for each asset.
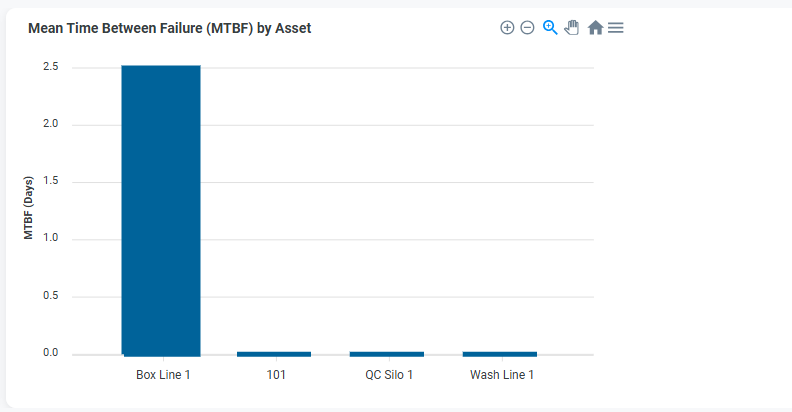
This helps identify:
- Assets with frequent failures
- Reliability issues
- Candidates for maintenance improvement or replacement