Start A Production Run
With assets, items, item-asset links, and production rates in place, we can now go ahead and manually start a production run, enter counts and run state information, and review the result in the Run Review screen.
Set The Home Page
The home page is a configurable dashboard which allows you to set what is displayed on the home page every time you log in. It is specific to the logged in user. Gateway Admins can also make this the default page for guest users.
Reference Materials: Dashboards - Learn how to create your own custom dashboards.
In 2020 Inductive Automation released the perspective dashboard component. With this addition to the component palette, users now have the ability to create their own analysis and operational screens from the browser without having to touch the designer.
KanoaMES extends this component to provide a self-serve user dashboard and marquee implementation.
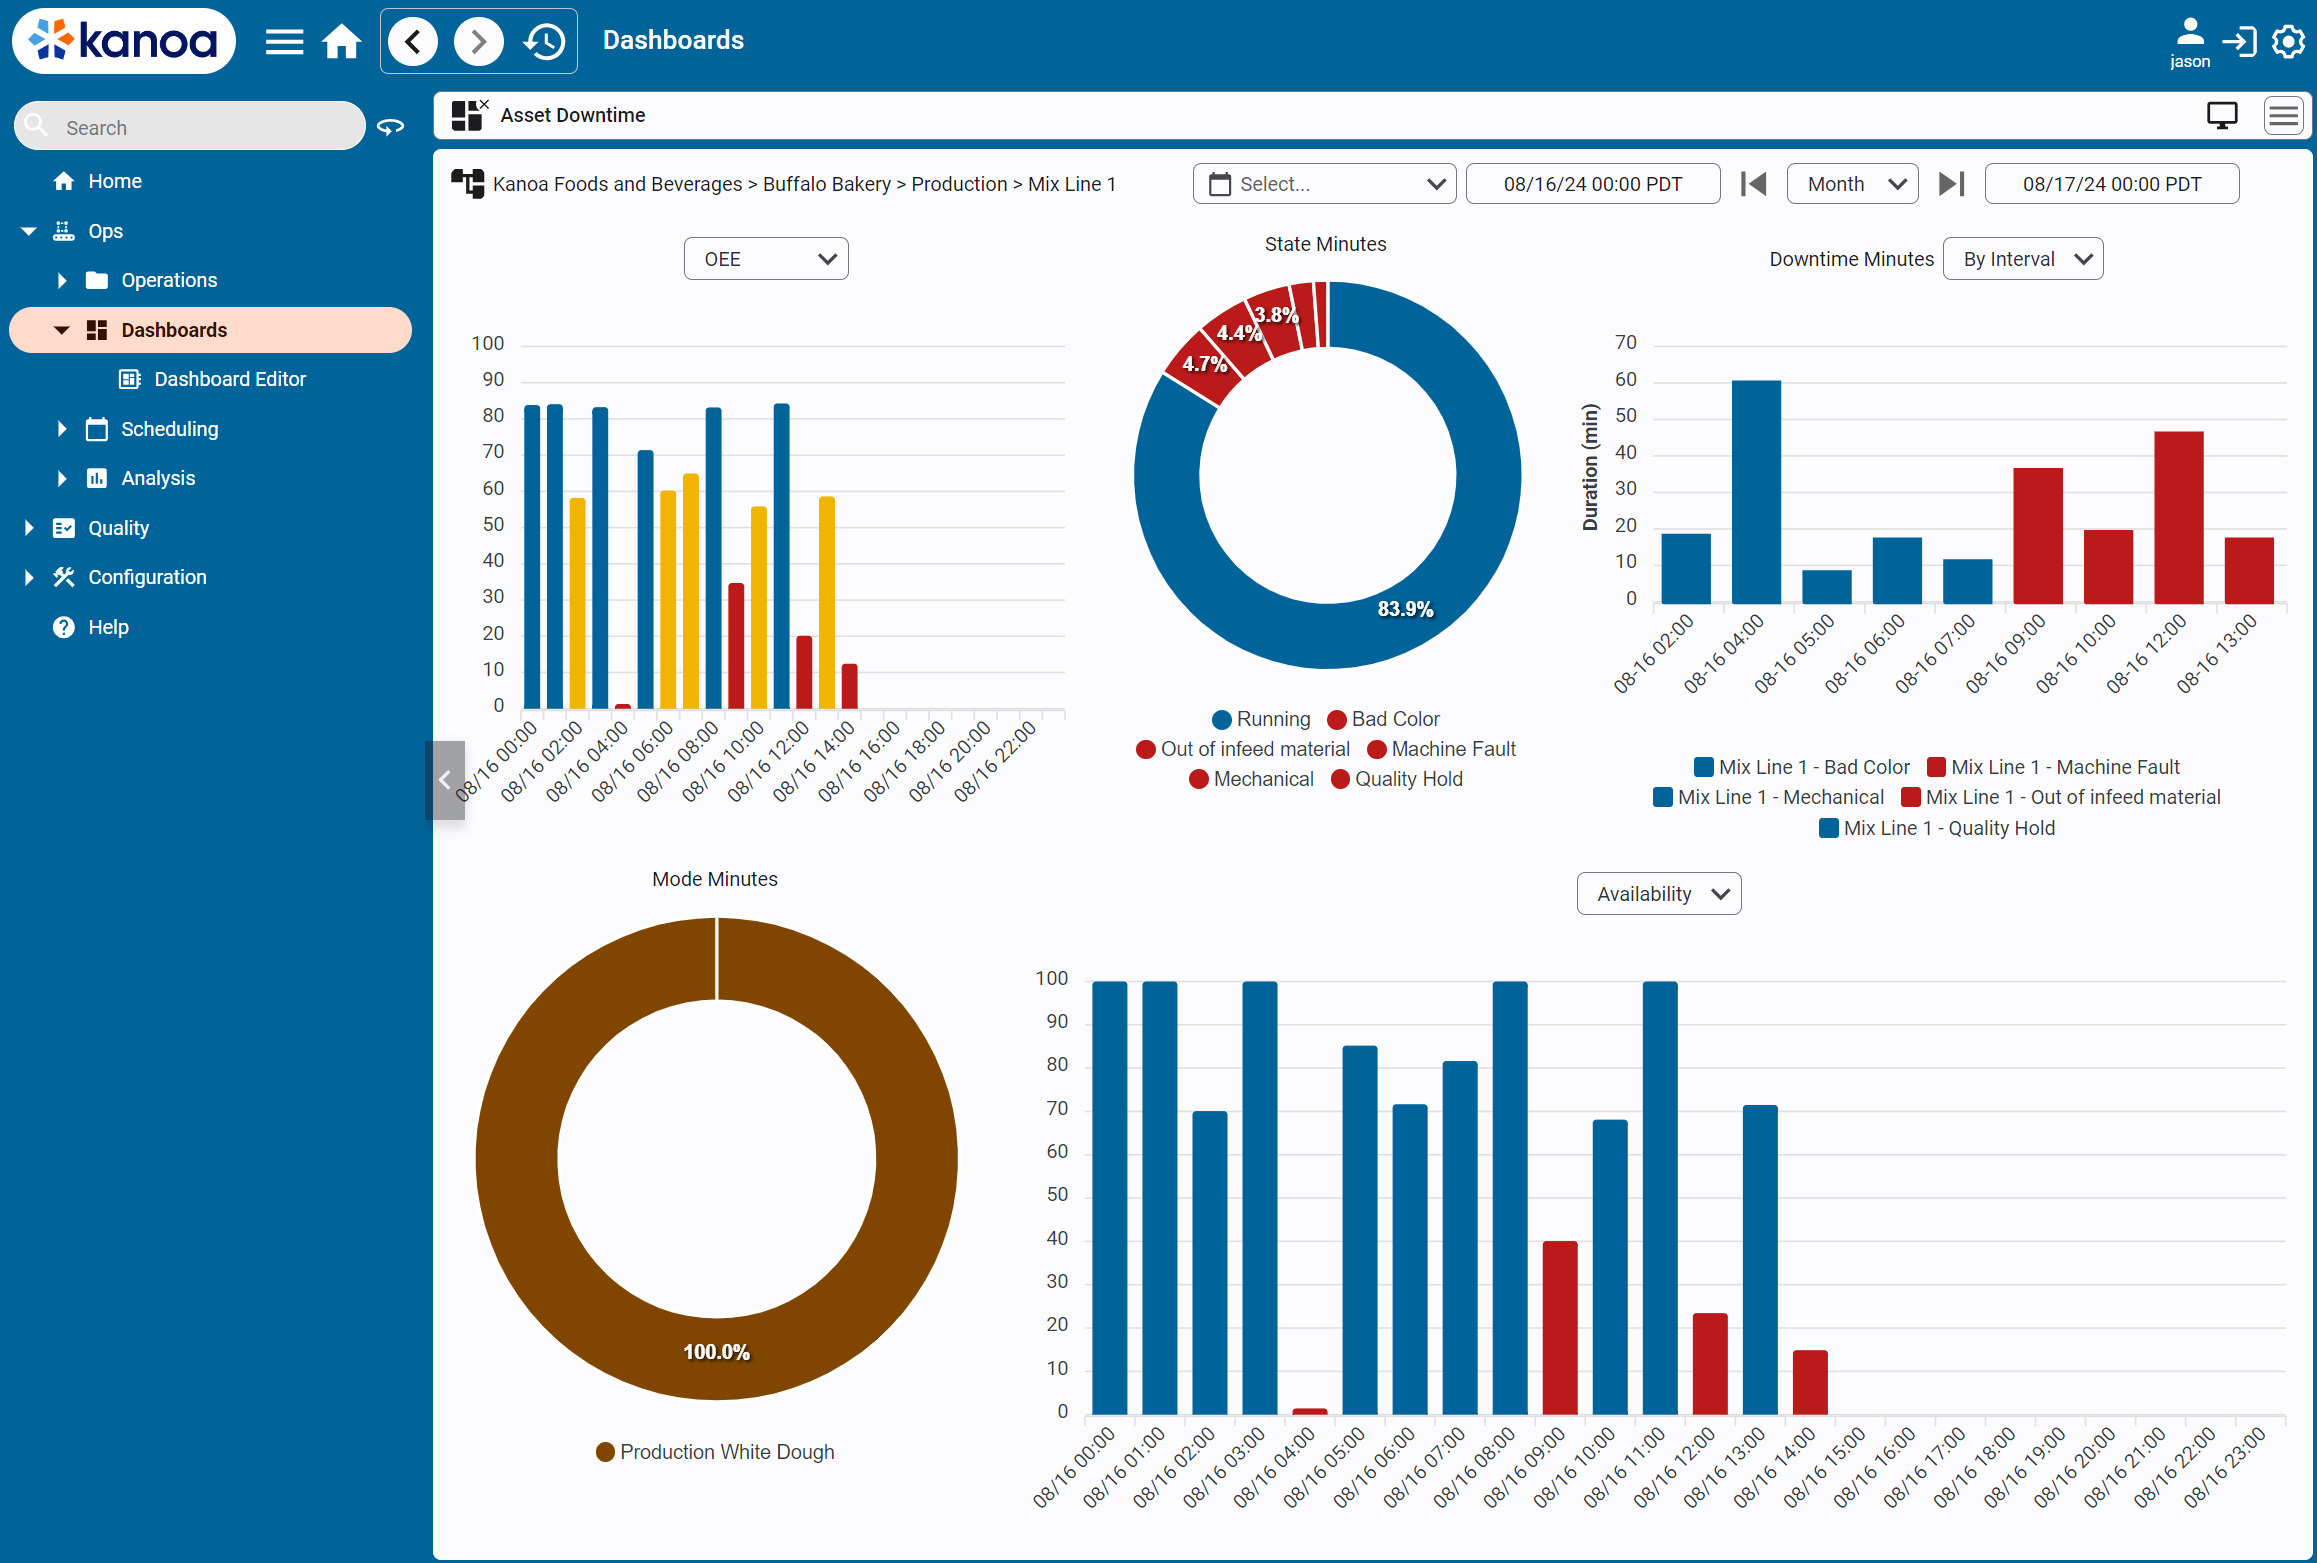
The Home page now points to the Dashboard Viewer. Users that have GatewayAdmin rights can setup the default dashboard that will be displayed.
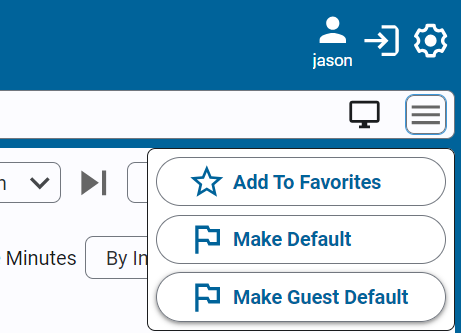
Users can can select a different dashboard and set that to be their default dashboard.
Dashboards can be grouped together in Marquees that can rotate through each dashboard on Andon boards and Big TV's around your plant.
The Dashboard Editor
Dashboards can be created by selecting 'Dashboard Editor' in the navigation menu. A dashboard consists of a number of widgets that are positioned within a dashboard.
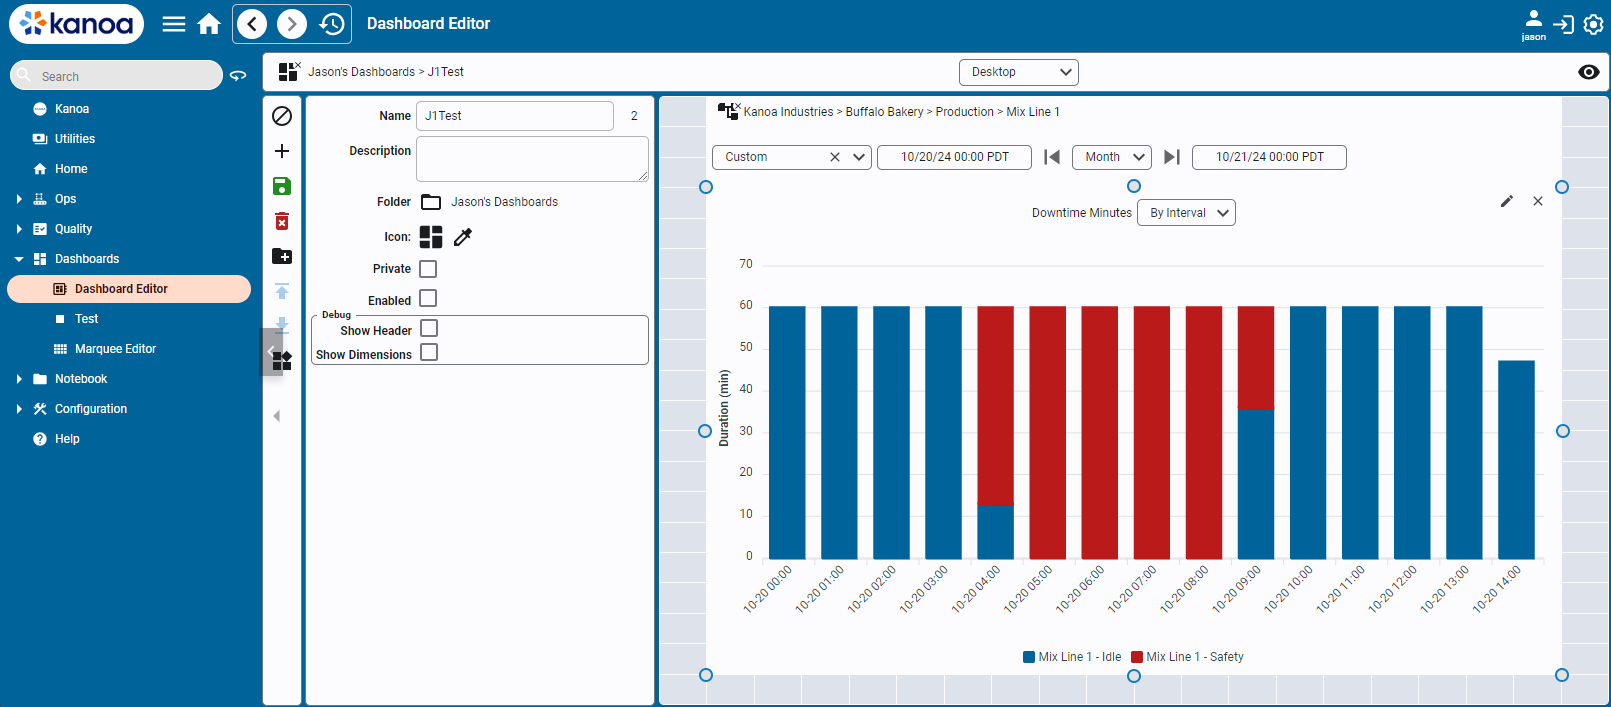
To create a new dashboard, click the + button. To edit an existing dashboard, select the dashboard.
Dashboard Info Panel
- Name - Give a name to your dashboard. The dashboardId will be shown on the right.
- Description - A description of what this dashboard does.
- Folder - Dashboards can be grouped by folder. To edit folders, select the

- Private - A dashboard can be made private to the user who created it by enabling the 'private' checkbox. Public dashboards can be viewed by everyone.
- Enabled - A dashboard must be enabled to show up in the dashboard selector.
- Debug - Show Header - When enabled, each widget will display the widgetId, widgetName and dashboardWidgetId in the header
- Debug - Show Dimensions - When enabled and in view mode
 , an icon displaying the identified breakpoint with a tooltip will be displayed next to the icon
detailing which breakpoint is being shown.
, an icon displaying the identified breakpoint with a tooltip will be displayed next to the icon
detailing which breakpoint is being shown.
Breakpoints
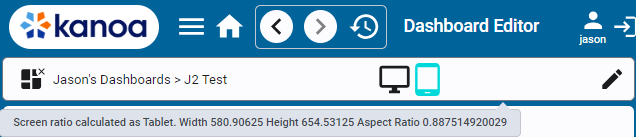
Breakpoints allow you to change up what is displayed based on screen size and orientation. We have created three breakpoints, 'Desktop', 'Tablet' and 'Mobile'. If only one breakpoint is configured for a dashboard, that is what will be shown regardless of screen size and aspect ratio.
Creating Widgets
From within the Ignition Designer, any view can effectively be turned into a widget. How well it responds to a mobile responsive environment is entirely in your hands and will be dependent upon how you have constructed your view. We recommend using flex containers almost exclusively as that is the standard container for web design.
We'll use the assetDowntimeBarChart widget as an example. Widgets views can be created under any folder. We are creating ours in the kanoa\core\dbp\widgets folder in the kanoaAPP project. Yours will be somewhere in your project.
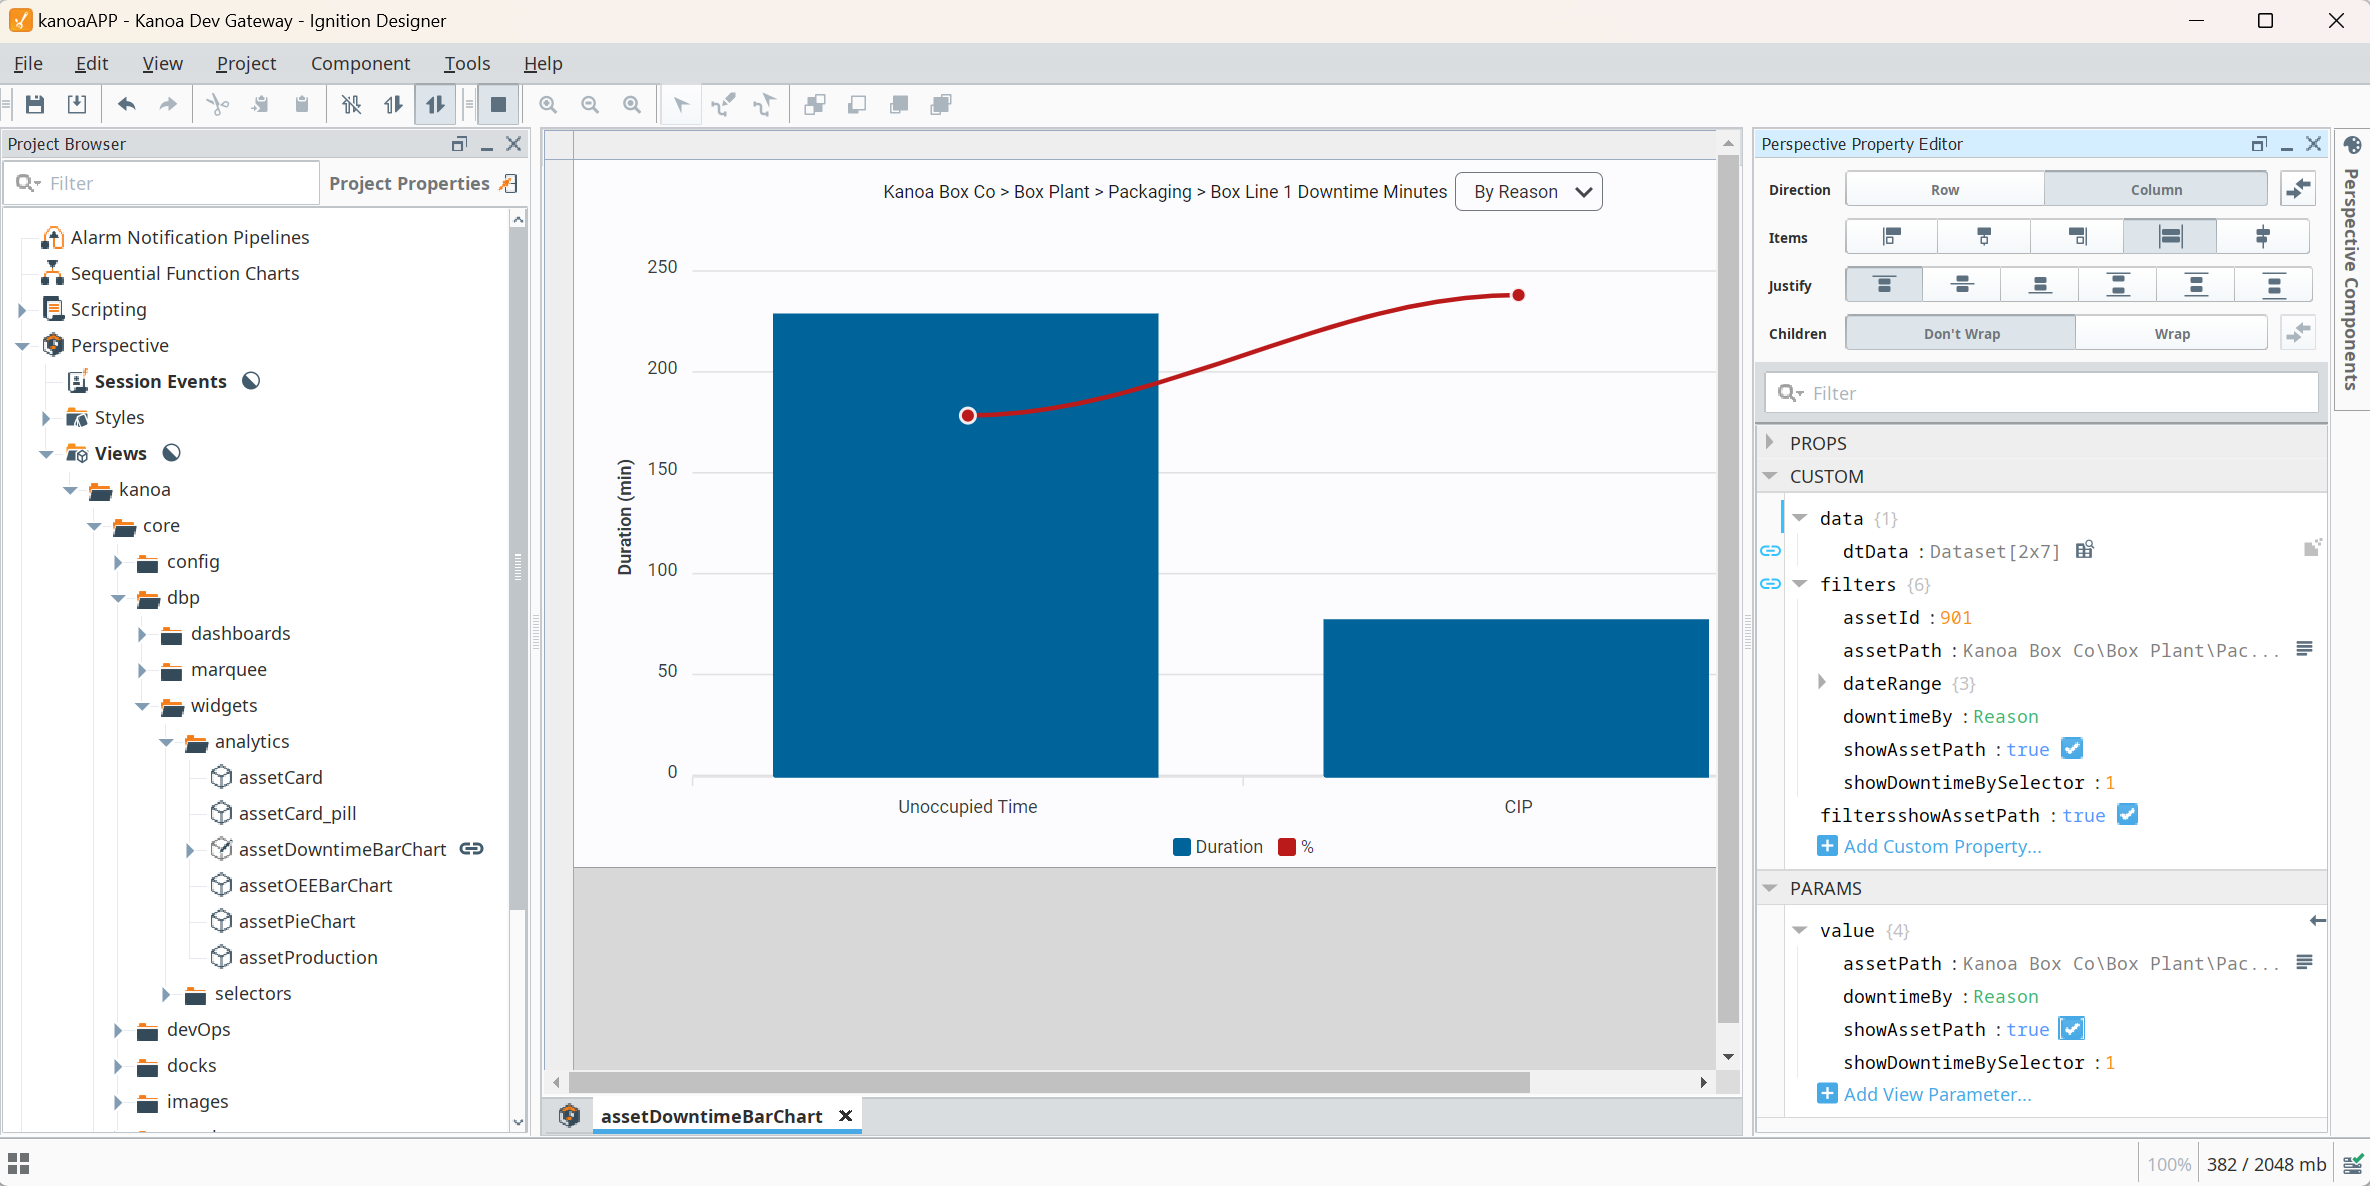
The only requirements for a widget is that the view parameters start off with a dictionary called 'value'. This is a common practice of ours here at Kanoa. For one it enables a view to be used as a sub-view in a table, it also makes it simple to copy and paste view parameters between views in the designer when testing and debugging.
To make a widget respond to the asset selector and date selector widgets, take a look at how we implemented our view custom property filters binding.
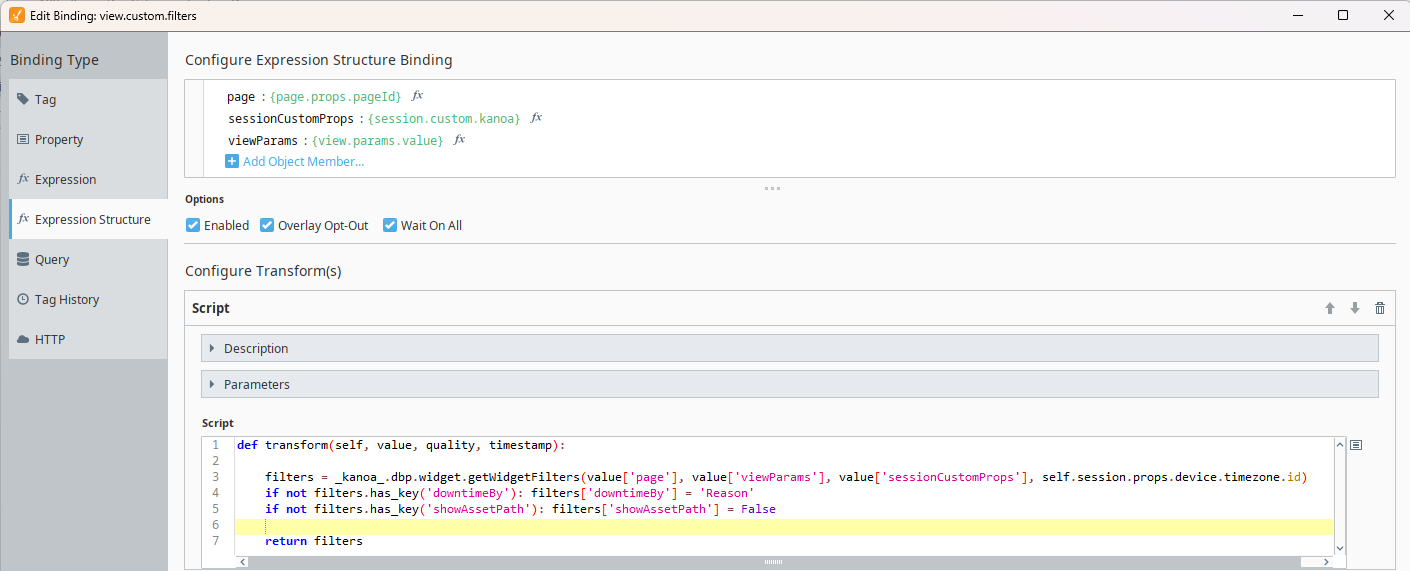
The function kanoa.dbp.widget.getWidgetFilters() checks the view parameters and the custom session properties to build up a set of filters that can then be applied to the widget.
To turn a view into a widget or edit an existing widget, click the  button.
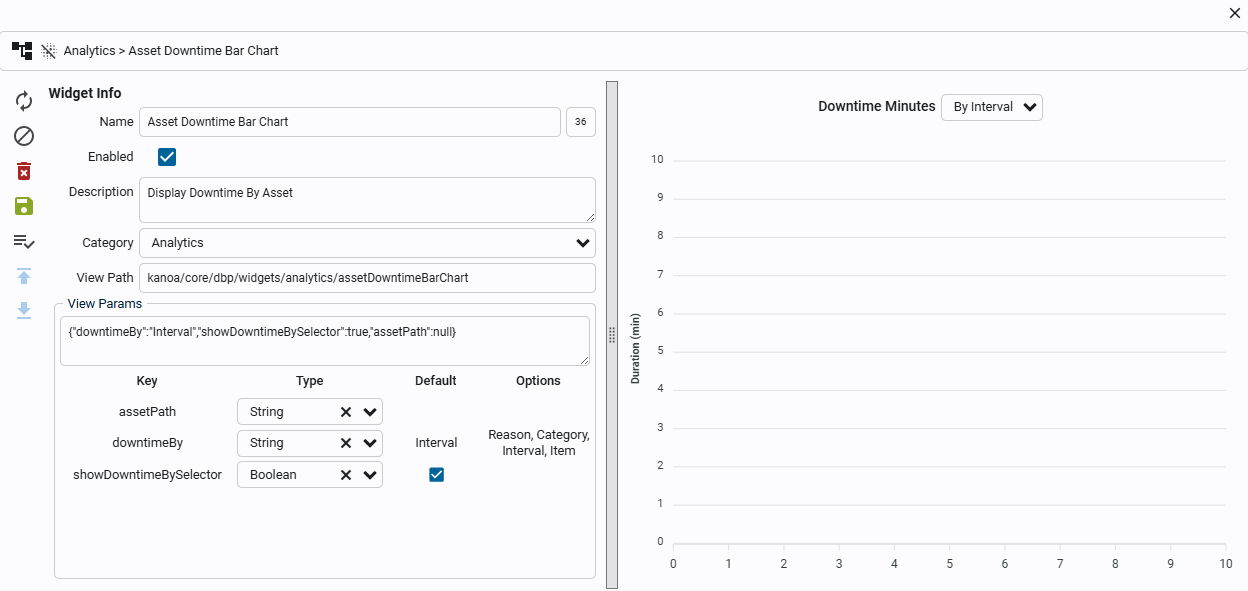
Widget Info Panel
- Name - Give your widget a name. The widgetId will be shown on the right.
- Description - A description of what this widget does.
- Category - Select or create a new category for this widget. When adding a widget to a dashboard, this widget will be displayed within this category.
- View Path - Copy the view path of your widget from within the Ignition designer.
- View Params - Copy the view params from this view. As mentioned above, the only requirements for a widget is that the view parameters start off with a dictionary called 'value'.
View parameters may be edited directly by editing the object string in the text area, or they may be edited by the table interface below.
Parameter variable types may be specified in the Type dropdown. A default value may also be configured by editing the Default column cell.
Parameters may be configured to have preset options, by editing the Options column cell. The Options cell value should be a comma separated list of string options.
Adding Widgets to a Dashboard
In the right hand pane, select and drag an area to add a widget. We provide some widgets out of the box for you. Custom widgets can also be added.
We have provided a couple of selector widgets, Asset Selector and Date Range Selector. These are special widgets in that there are no user settable parameters and are only used to effect the behavior of other widgets. With these widgets, a user can select a specific asset and date range to be applied to all other widgets on that dashboard, achieved through the use of custom session properties.
Editing Dashboard Widgets
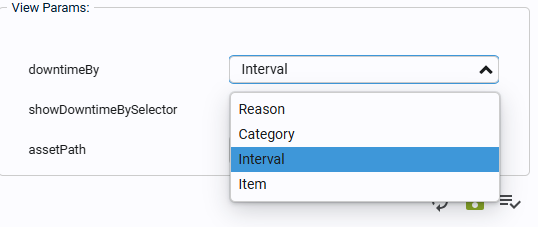
Once a widget is added to a dashboard, its specific view parameters may be configured. Parameter values may be typed out in the text-field, or selected from a dropdown if options for that parameter were configured.
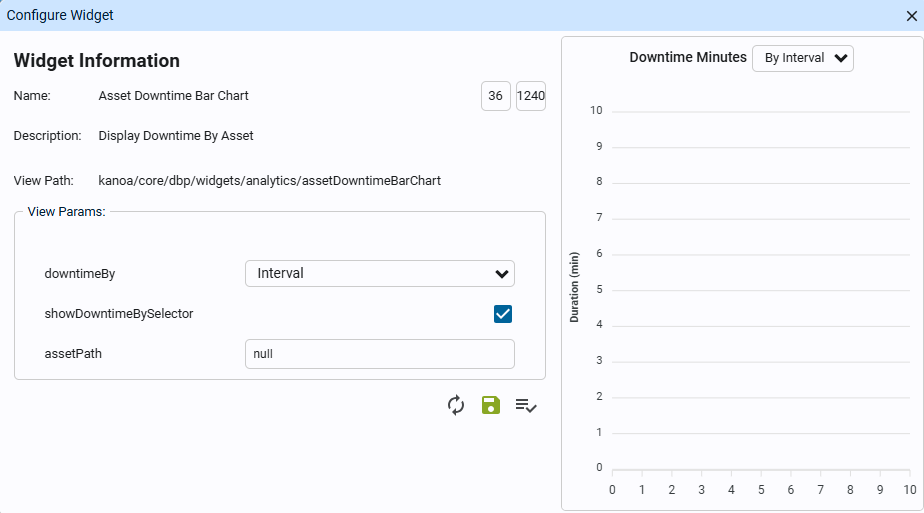
In the previous example, options were configured for 'downtimeBy', so now it has a dropdown selector to pick options from.
Click the Home button to return to the main page. You'll likely see the Welcome dashboard or a blank page.
- Click the Dashboard icon in the upper left.
- Select Asset Overview Dashboard.
- Click the three dots in the upper right and select Make Default and Make Guest Default.
What is displayed on the Asset Operation screen can also be customized by asset.
- Click
Machine 1on the System Overview dashboard to open the asset operation screen. - Click the Dashboard icon.
- Select Operator Dashboards → Operator Station Full.
- Set it as the Default for this asset.
- On the
Machine 1Asset Operation screen, select the Product tab on the Run Control widget. - Select
SC-2024and click Start Run.
- Change the state of the asset to
Runningon the Asset State widget. - On the Counts widget, set the date range to Current Run and click the Count view icon. You'll have to clear the selected 'Current run' and select it again to get it to refresh the dates.
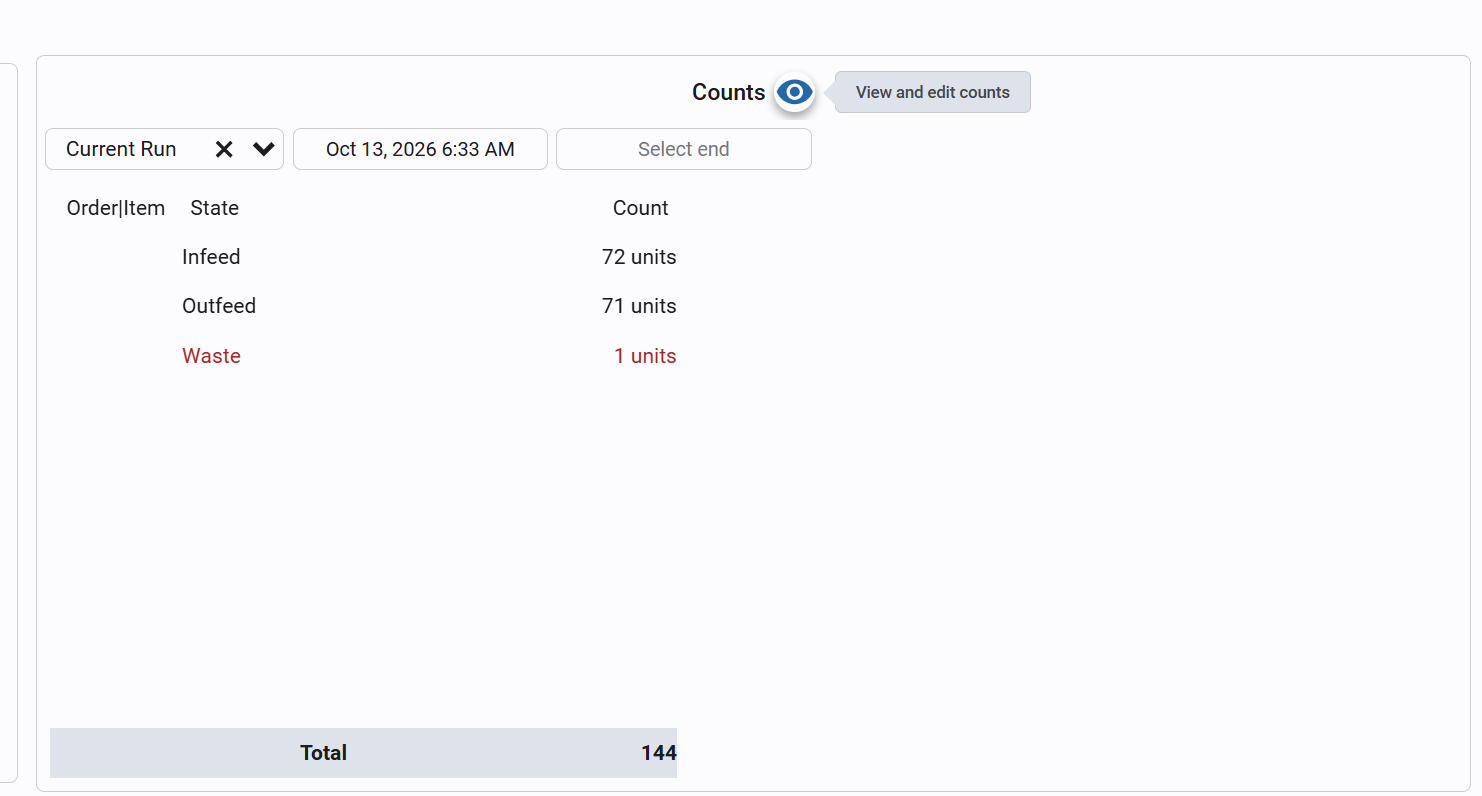
- Add some infeed and outfeed counts.
You should be able to see the counts and state change on the left-hand panel of the Asset Operation screen.
You'll also notice that we are now actively calculating OEE for the Machine 1 line.
- Navigate to Ops → Operations → Run Review and select
Machine 1. - Select the production run and click the eye icon (or double-click the row) to see its counts and downtime (state) events.
Reference Materials: Run Review - Review and edit production run counts, mode events, and downtime.
The Run Review screen provides both analytics and the ability for the production run data such as counts and downtime to be edited based on a user's roles. Users may view an asset's production runs within a specified time range, with filtering by mode enabled. Run Review data is only viewable when an OEE-enabled asset is selected, which usually would be a line asset.
Users may:
- Add, edit, and delete mode events
- View and edit production run counts
- View, add, edit, and delete downtime events
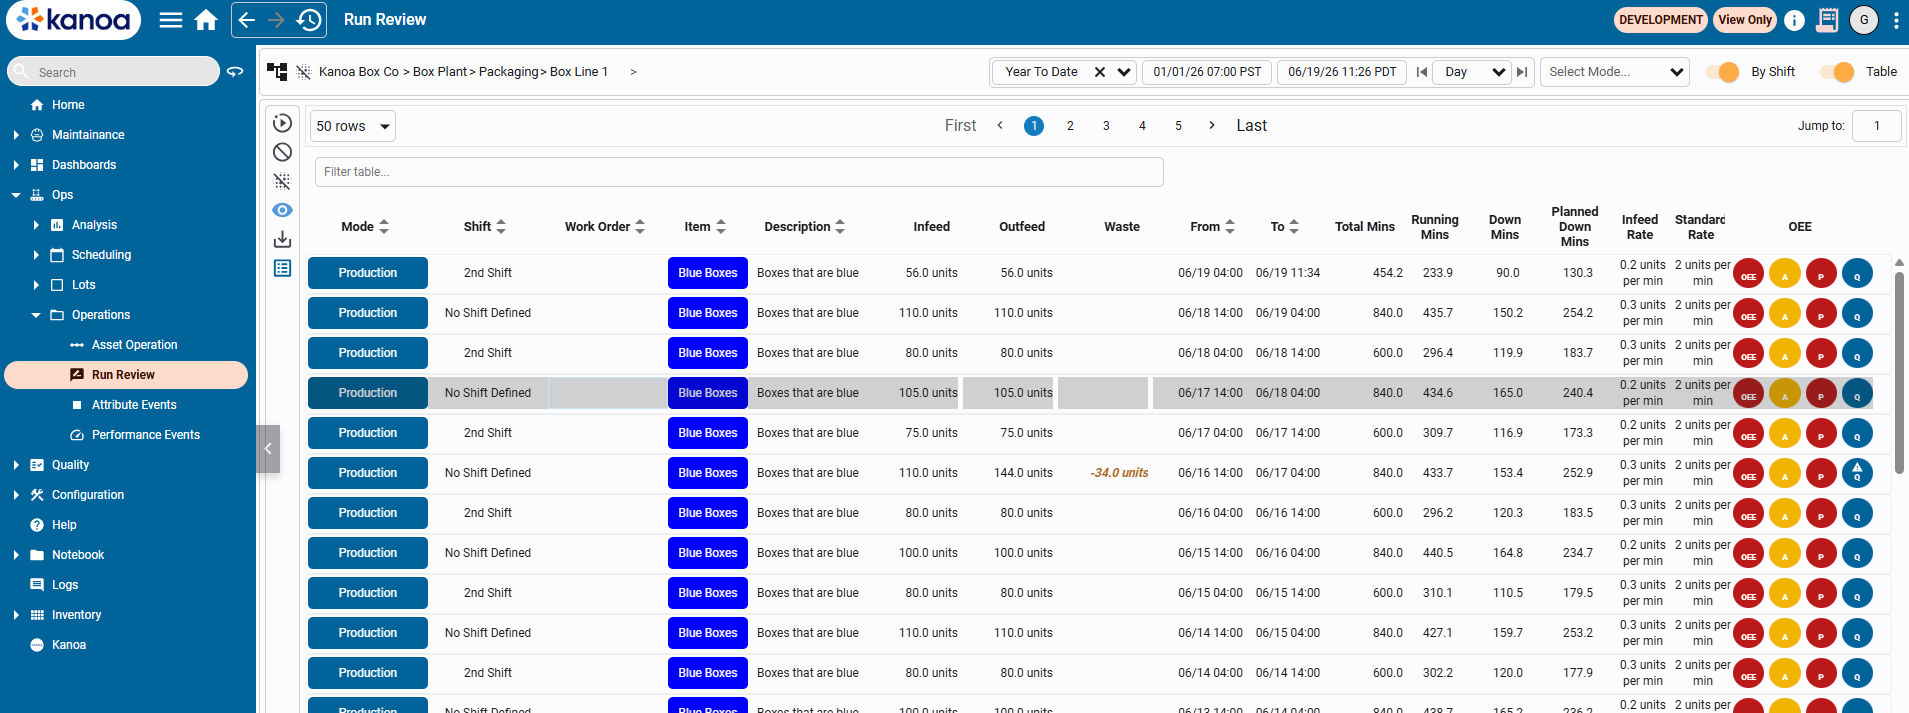
More details on a specific production run can be viewed by selecting a row and clicking the eye icon, or by double clicking the row. More in-depth information on a production run includes counts and downtime data.
Mode Events
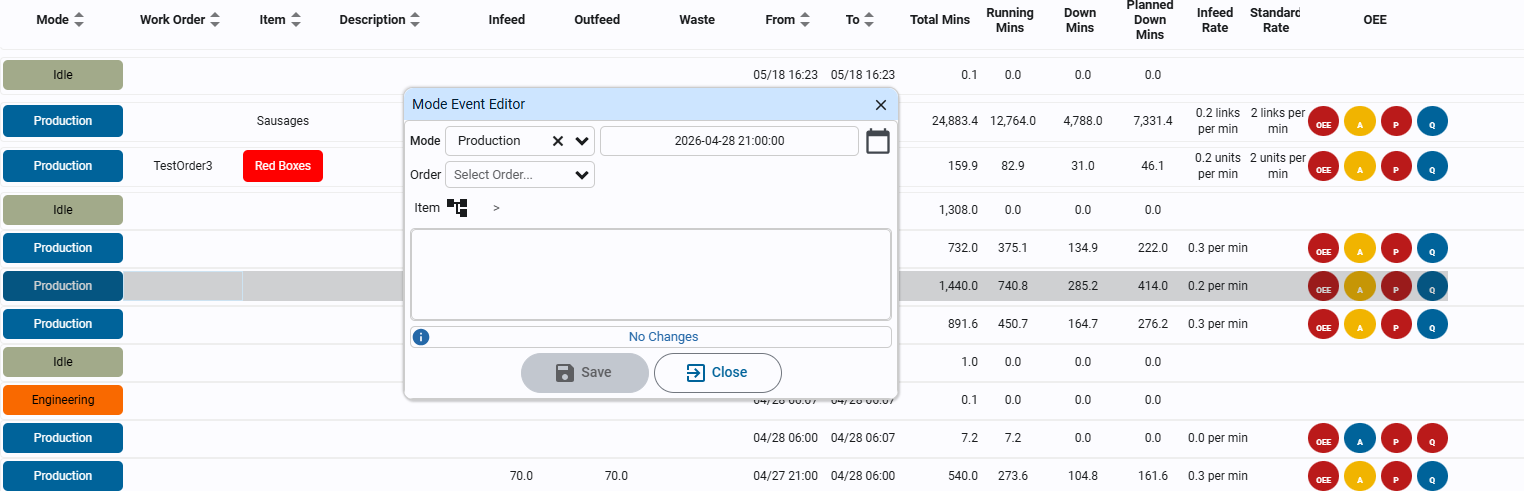
A mode event represents a duration of time where a line level asset was in a specific mode. When a line is in production, mode events may be further separated by work order, item, and infeed rate.
Mode events can be added, edited, and deleted. Allowed editing for a mode event includes its mode, start time, work order, item, and description.
Counts
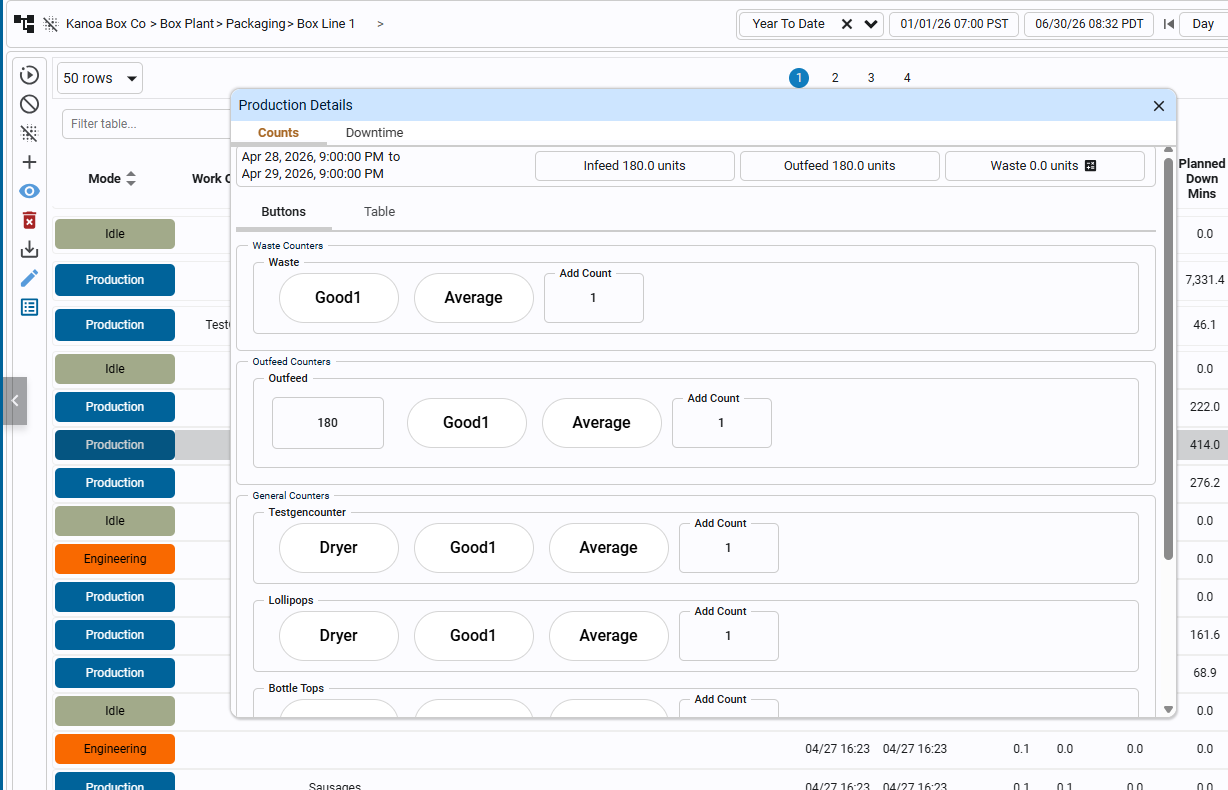
Counts refer specifically to infeed, outfeed, and waste counts of a mode event. Users may retroactively update any of these counts. In order to do this, select a production mode event in the table, and press the eye icon.
In the Counts > Buttons tab, we can see buttons and numeric fields for each type of counter. Each counter type has different buttons to denote the item state of a count. To add a count for a specific item state, press the corresponding button. In the add count field, you may specify the exact value of counts to add. Counts may also be edited in each of the numeric fields.
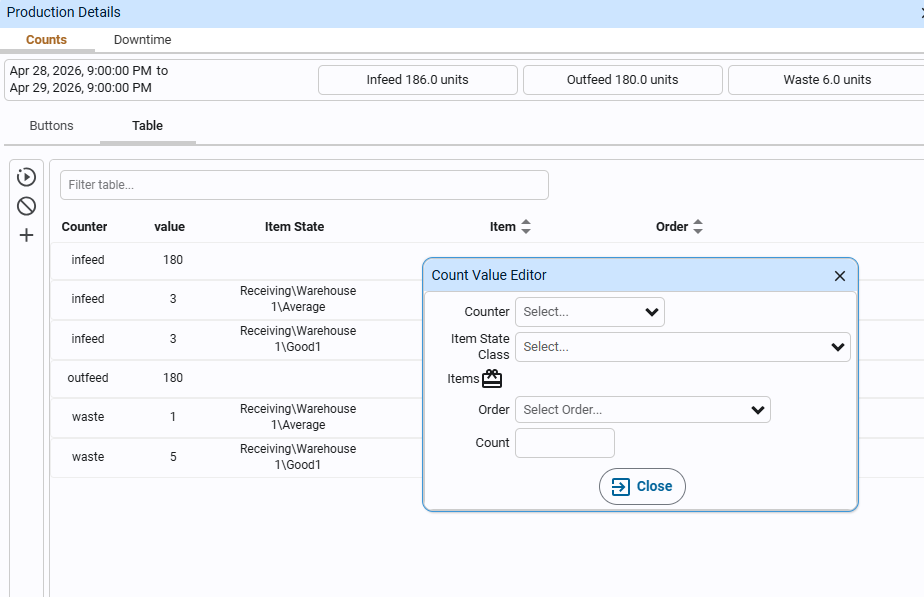
The Counts tab also has a table view, where adding, editing, and deleting may be done with a more conventional UI.
Downtime Events
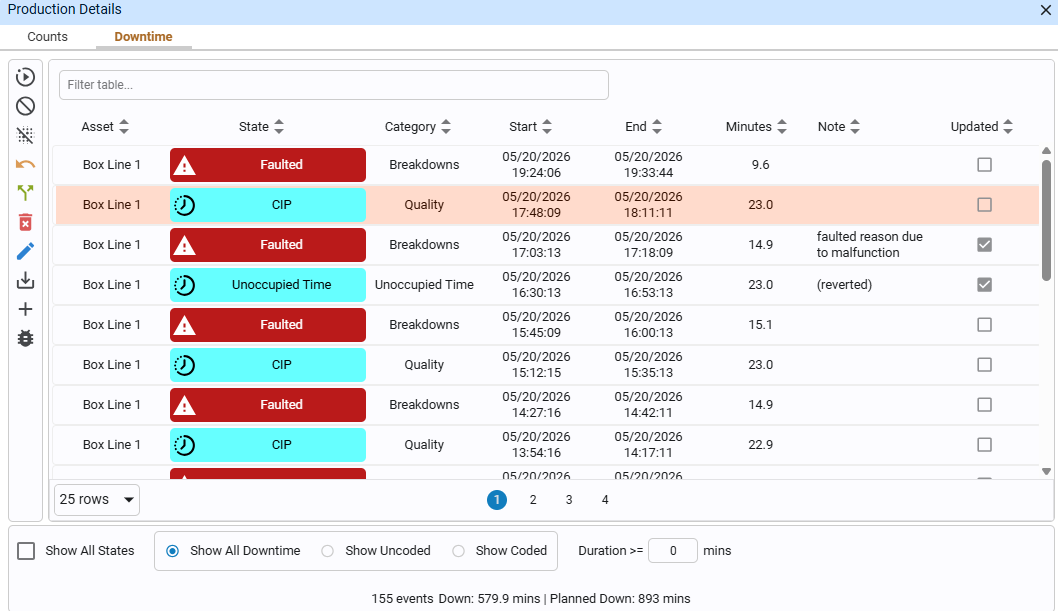
In the same popup, a mode event's downtime events may also be viewed in the Downtime tab. Downtime events can be filtered in the footer to show only strict downtime, or to also be able to explicitly see when the line was running. Downtime events may be filtered by All/Uncoded/Coded, and a minimum duration filter may also be applied.
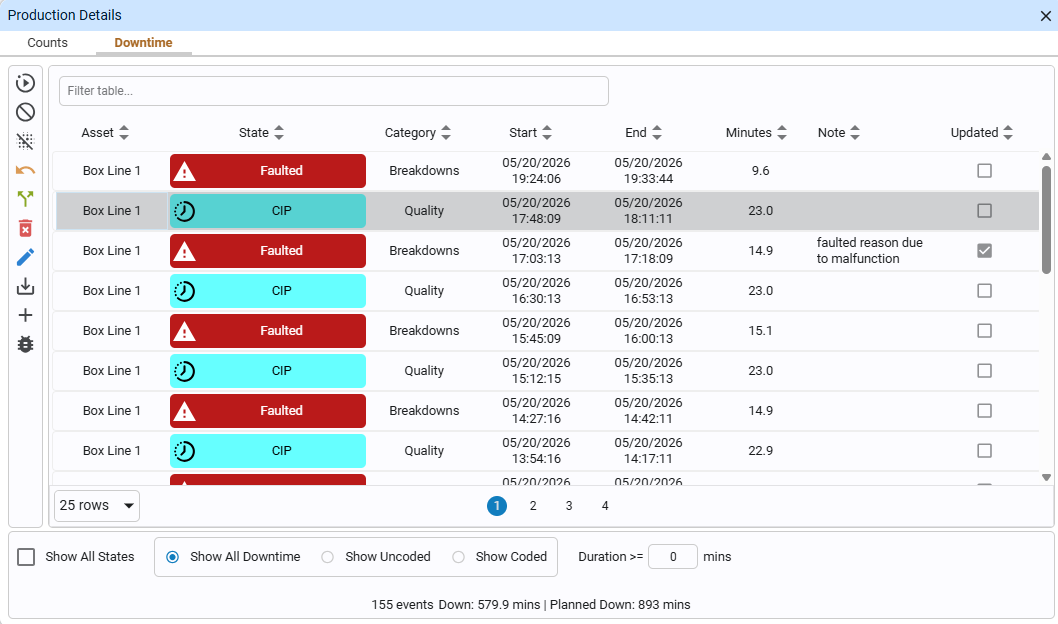
Downtime events may be added, edited, and deleted. A downtime event's asset and state may be edited, and comments may be written for the downtime event as well.
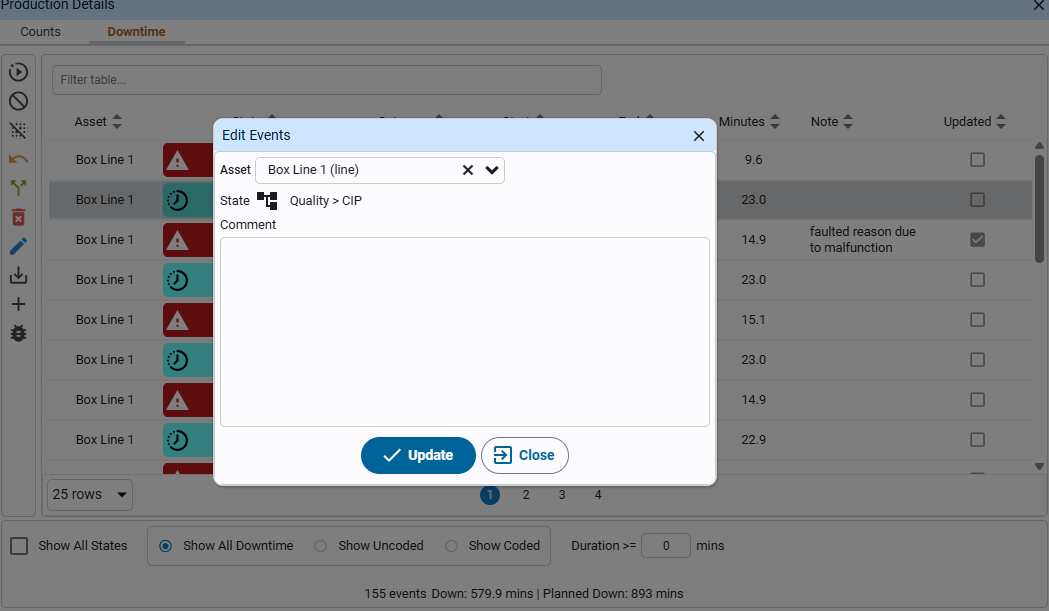
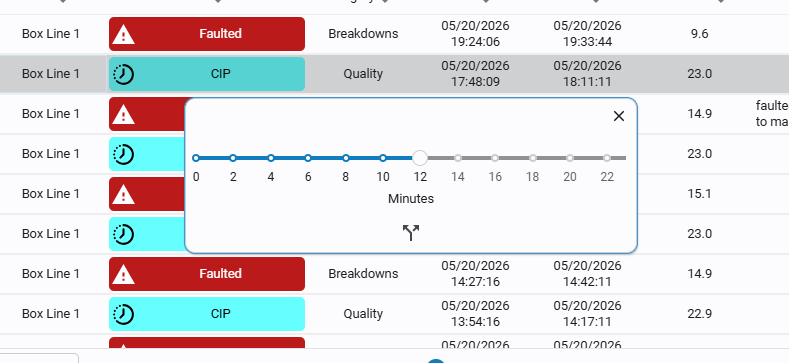
The Downtime editor also allows for more specific editing such as splitting, which allows the user to split a singular downtime event into two. The specific time of split may be specified by the minute within the duration.
Planned downtime events are allowed to be reverted, with the yellow reverse arrow button. Reverting a planned downtime event changes its state to Unoccupied Time, and leaves a note that it was reverted.
Reference Materials: OEE - Learn how OEE is calculated.
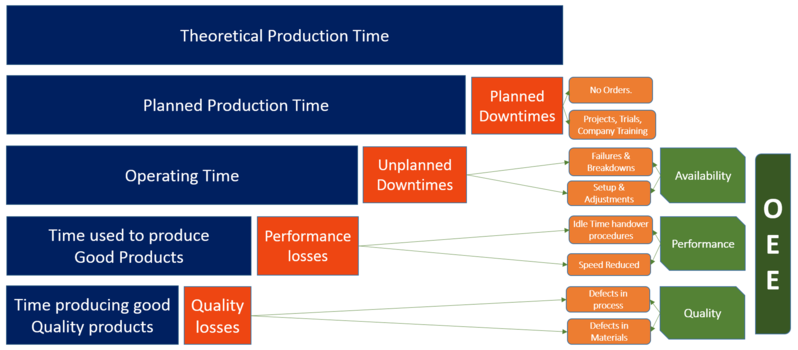
Overall Equipment Effectiveness identifies the percentage of manufacturing time that is truly productive. An OEE score of 100% means you are manufacturing only good parts, as fast as possible, with no downtime.
Fair warning though, you can get the same exact OEE number for entirely different utilization scenarios.
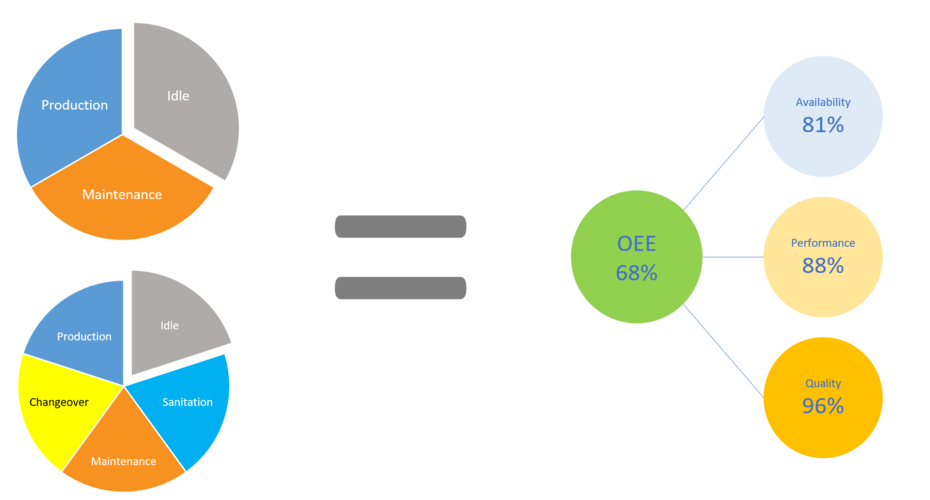
OEE is often considered meaningless without utilization context. To address this, many implementations stretch OEE to cover 100% of time, categorizing idle time as unplanned downtime. But is this the best approach? The Goal says it's ok to have local inefficiencies; idle time allows for more capacity planning. OEE should focus on how well we operate when we are expected to operate, but utilizing the assets have efficiently may be a bigger problem than how well they run during production. Reducing changeover, setup time, or maintenance may have a greater impact on your bottom line than reducing scrap or rework. This is not to say OEE is not important, just that it should be your only focus.
OEE Calculation
OEE is a widely accepted lean manufacturing standard, and extensive resources are available online. Here, we�ll focus primarily on how it is calculated and how it can be customized.
The term OEE was invented in the 1960s by the creator of the Total Productive Maintenance system, Seiichi Nakajima. OEE is expressed as a percentage from 0 to 100, where an OEE score of 100 percent would indicate that a manufacturing line or cell was producing only good parts at the anticipated production rate with no unexpected stops.
OEE is calculated by multiplying Availability * Performance * Quality
Availability
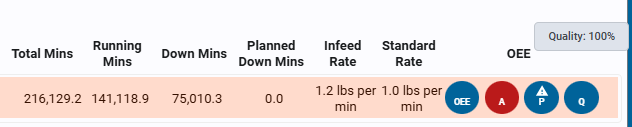
Availability = runtime / (runtime + unplanned downtime)
When an OEE_Enabled asset is in production mode, the amount of time the asset state is in a 'running' type state compared to an 'unplanned downtime' type state is pulled from the mes.stateEvent table to calculate Availability.
Planned downtime events such as a 'Clean In Place' step are excluded from the availability calculation.
Refer to the Asset States section of the Asset Configuration page for more info on setting up asset states and modes.
Performance
Performance = infeed count / (infeed rate * runtime)
Performance looks at infeed count and runtime, not outfeed count and total time as downtime and scrap would then skew the performance metric. Performance should only indicate processing speed issues.
If no infeed count is captured or entered for the asset, the outfeed count will be multiplied by the package count to calculate the infeed count.
The infeed rate is taken from the standard rate set for the item (material) when it is processed on the asset. The standard rate is set in the Materials Production Rate screen. Refer to Materials Configuration section of the help for more details.
Sometimes the standard rate set for an item running on an asset may be affected by other external factors such as crew size, inclement weather, or moisture content of incoming material. To handle this, the standard rate can be modified and set at the time the asset is in production via the system.kanoa.event.assetOperationChange() system function.
Quality
Quality = outfeed count / infeed count
To be able to provide a 'Quality' metric for OEE, we're going to need at least two counts. It can be infeed and outfeed, outfeed and waste or infeed and waste. If only one count is provided, the Quality metric will default to 100%.
Color Coding OEE
Wherever we show OEE Analytics, the metrics are color-coded in green (good), orange (warning), red (bad). The thresholds for setting the coloring are configured in the Asset Configuration screen. Refer to Asset Configuration for more details.
Modifying OEE
We're not actually suggesting you modify OEE because it is a standard and bear in mind that OEE is math, if you use it the way it was intended, it can be quite useful in planning.
Example: Using OEE to Estimate Order Completion If the average OEE for an asset is 67% and the standard deviation is fairly low, you can use this number to determine how long it will take to complete an order. For example, Order XYZ requires 10,000 cases of Product A. With a Standard Rate of 200 cases per hour and an OEE of 67% (due to downtime and scrap), the actual expected production rate becomes: Standard Rate x OEE = 134 cases per hour Total Estimated Order Time = 10000 Cases / 134 cases per hour = 74.6 hrs.
Having said all that, the data points needed to determine OEE (runtime, downtime, std Rate, counts etc.) are exposed by our system functions.
If you really want to change the way OEE that is returned, you can see how we calculate it in our stored procedures. We recommend making a copy of the stored procedure and using your own version within the application, as our procedures may be updated periodically.
OEE Analytics
OEE Analytics are shown throughout the application, from the asset card on the enterprise view to the 'Operator Station' screen. Regardless of where you get your OEE number, it is calculated from the same data source using one of several functions...
- system.kanoa.event.getOEEDataByInterval()
- system.kanoa.event.getOEEDataByIntervalByShift()
- system.kanoa.event.getOEEDataSummary()
To understand more about how OEE is calculated and how it can be modified, please refer to OEE Configuration.
The OEE Chart visualizes the individual component parts that comprise OEE.
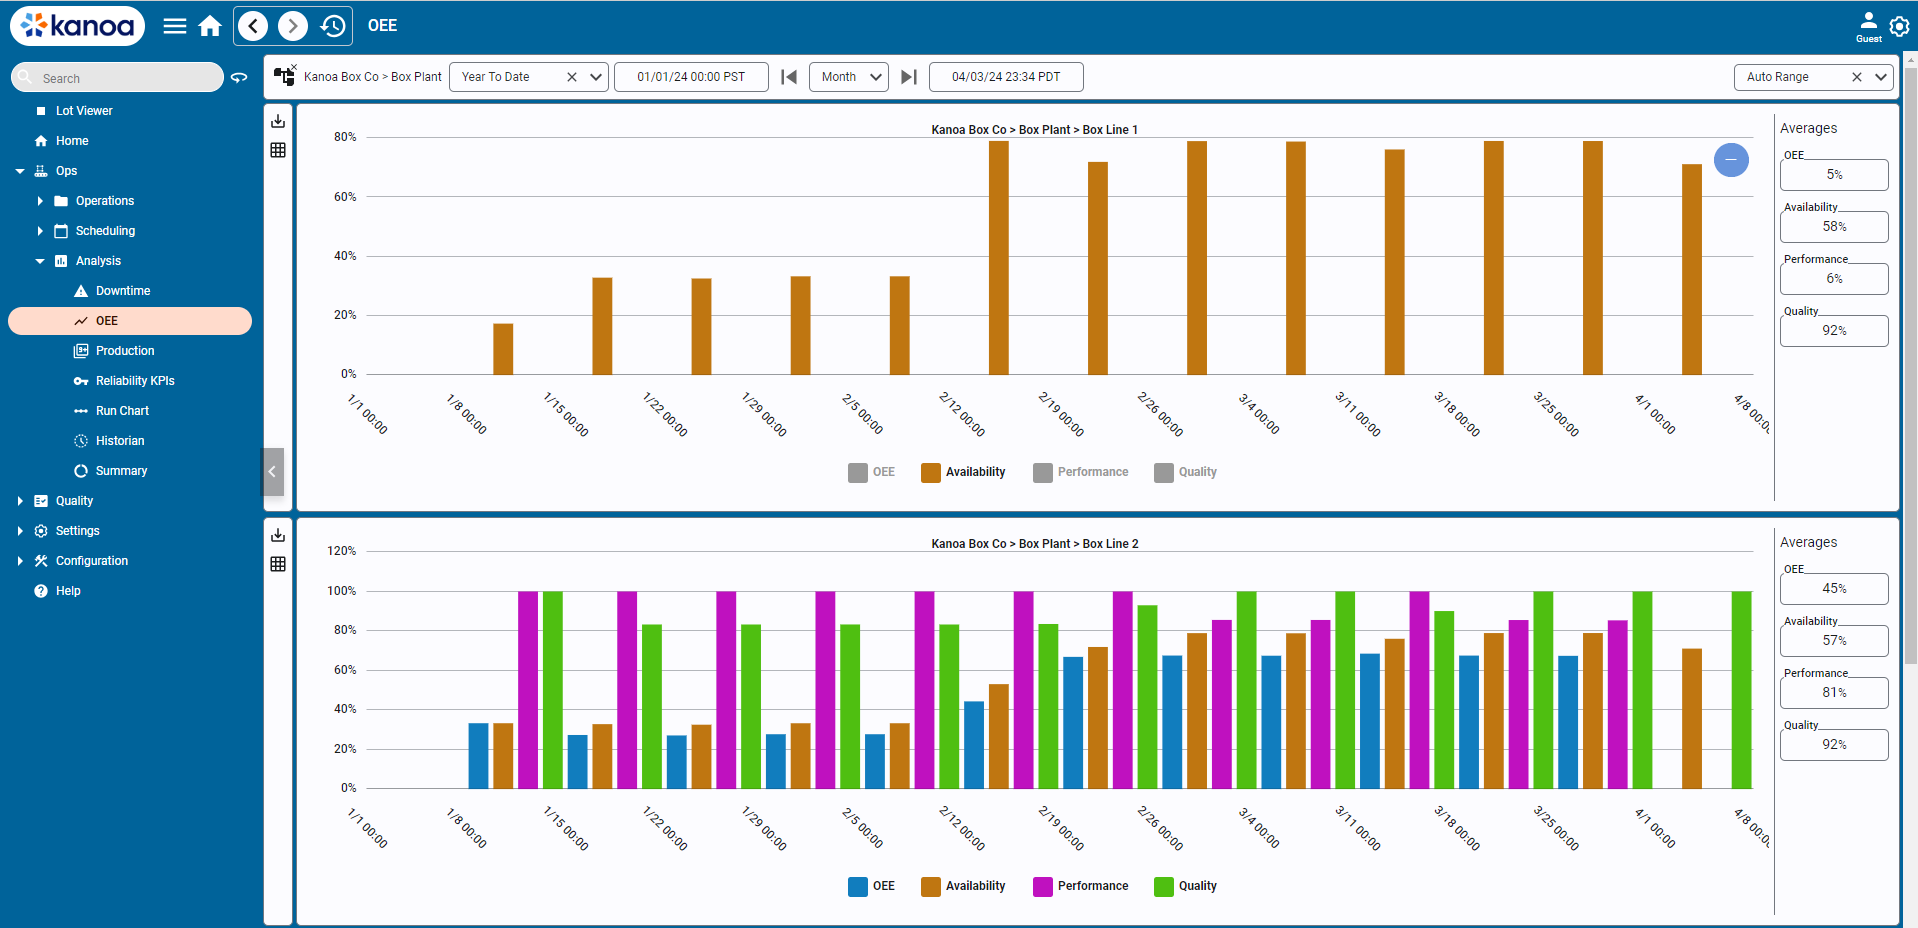
You can choose to chart OEE data for a specific asset or for all assets in an area, or at a site, for the given date range. By default, the interval (time period) is automatically determined based on the date range selected. If a range of one day is selected, an hourly interval is chosen. If the date range crosses multiple days, the interval will be by day. If the date range crosses months, the interval will be by week. You can choose the interval you want, be aware that showing a years worth of data by hour may not render that well in the bar chart.
On the right side of the chart, the average OEE, availability, performance, and quality values are displayed.
Each of the plots can be toggled on or off by clicking in the chart legend.