Configure Assets
Almost everything in Kanoa MES hangs off an asset: a piece of equipment, or a place in the plant. Runs, downtime, counts, checks and work orders are all recorded against one. This lesson shows you how to look after the asset model, and where to find each part of an asset's setup.
Adding, editing and deleting assets needs the Configure Assets security function.
The Asset Model
Assets form a tree, following the ISA-95 levels: Enterprise → Site → Area → Line → Cell. In the CoreForge sample plant:
CoreForge                 Enterprise
└── Philadelphia          Site
    ├── Machining         Area
    │   └── Machine 1     Line
    ├── Coating           Area
    │   └── Spray Line 1  Line
    └── Finishing         Area
        └── Manual Pack 1 Line
The equipment that makes product, usually a line or a cell, is OEE Enabled. The enterprise, site and areas organize the tree; they don't run production themselves.
Add or Edit an Asset
- Open Configuration → Ops → Assets.
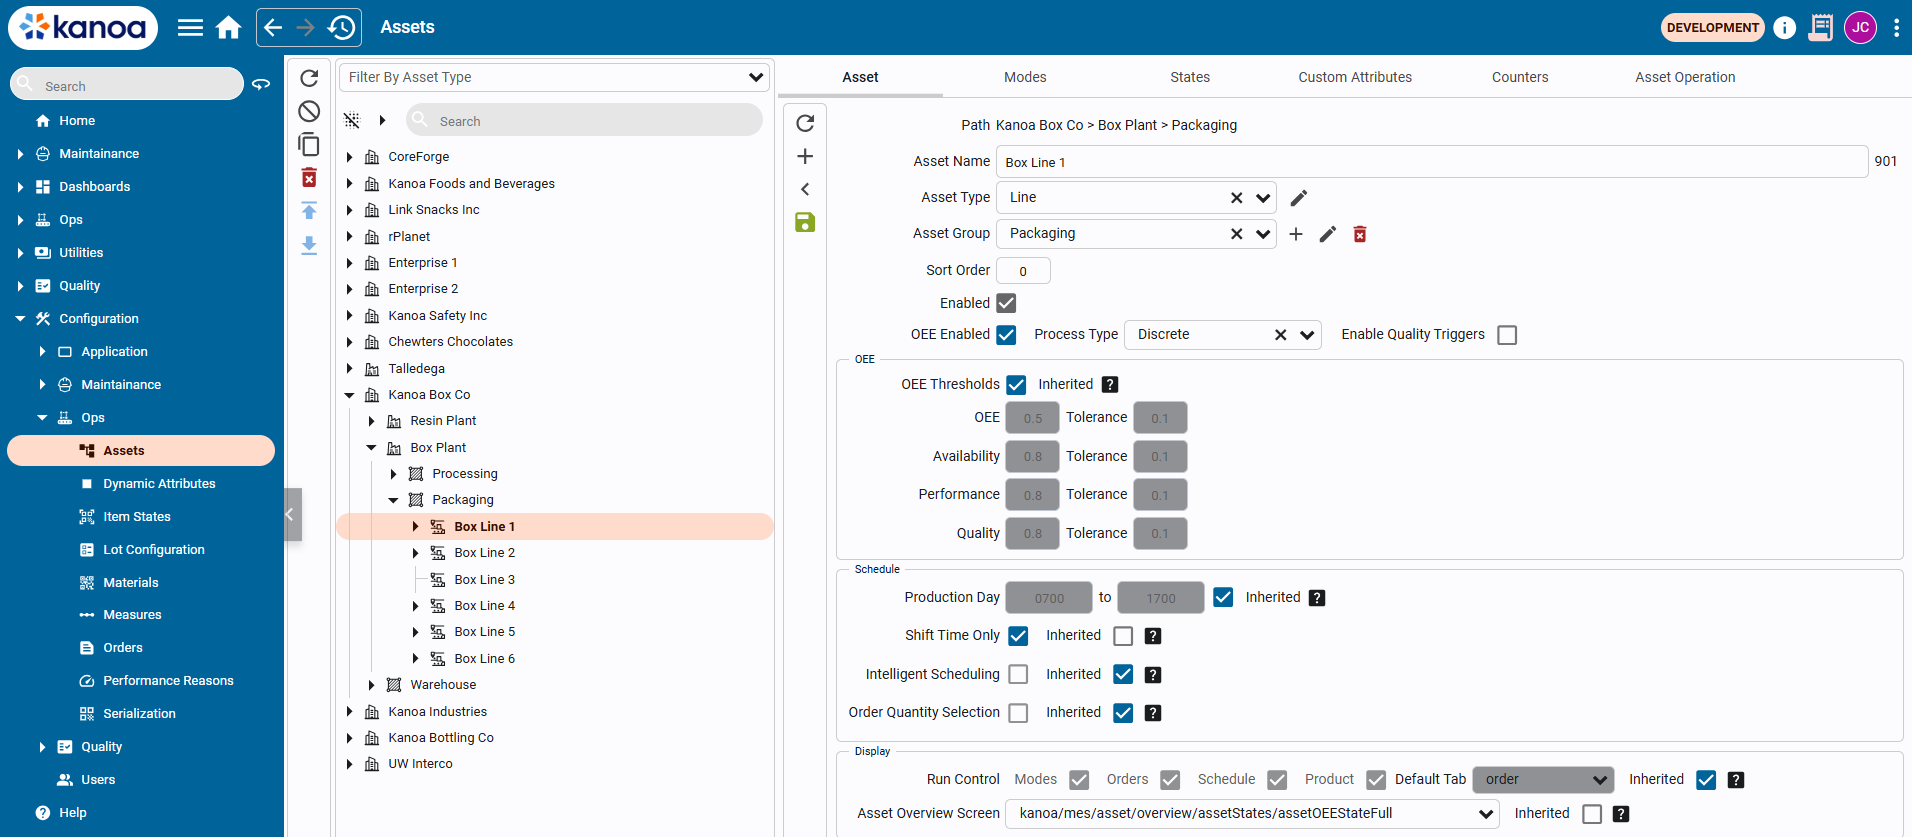
- To add an asset, select its parent in the tree and click Add. To change one, select it and click the edit button.
- Fill in the asset:
- Asset Name: unique under its parent.
- Asset Type: its level, such as Site, Area or Line.
- Asset Group (optional): groups similar assets across the plant for reporting, such as all box formers.
- Sort Order: its position among its siblings.
- OEE Enabled: on for equipment that runs production. You can then set its OEE targets, and Kanoa creates its data interface tag.
- Custom Attributes (optional): extra information, such as the asset's name in the ERP.
- Save the asset.
A site needs a Timezone before it can be saved.
Reference Materials: Add or Edit an Asset - Every field, and duplicate, delete, import and export.
Add or Edit an Asset
You can add an asset anywhere in the asset hierarchy by selecting a row in the asset table and clicking the 'Add' button. To edit an existing asset, click on the edit button after selecting the asset.
-
Asset Name: The name of the asset. Asset names must be unique within the parent.
-
Asset Types: Used for defining the type of an asset, akin to the ISA 95 hierarchy (e.g. enterprise, site, region). To configure asset types, use the edit button next to the 'Filter by type' dropdown at the top of the page.
-
Asset Groups: An asset can be associated with a group such as 'shredders'. Grouping allows for analysis of assets that may not be in the same hierarchical area but need to be reported similarly. For instance, assets like 'box formers' across different lines can be grouped under a single asset group for consolidated reporting. To add an asset to a group, simply select the group from the dropdown. If the group doesn't exist, start typing the name of the group into the dropdown and select 'create'.
-
Sort Order: Determines the asset's position relative to others.
-
OEE Type: One of the primary uses of an asset in Kanoa Ops is enabling it for OEE tracking. An OEE_Enabled Asset refers to any physical piece of equipment such as a production line, vessel reactor or process cell where operational data such as counts and equipment can be obtained and needs to be monitored. If an asset is set to OEE_Enabled, targets can be set for performance, availability, quality, and overall threshold that are used in visual indicators while an asset is in production. An instance of our assetOEE tag UDT is also created in the [Kanoa] tag provider that provides a mechanism for connecting the physical machine to our MES. See the [Configuring Tags] section below.
-
Custom Attributes: Metadata about an asset can be stored against an asset in the custom attribute tabs. We use '_tz' to store timezone information about a site, but you may want to store information such as the ERP name for an asset or the path to a custom setup screen for a specific asset. Whatever the use case, you can create whatever you want by typing in the name of the attribute and selecting 'create'. Once an attribute has been created, it will become available for any asset of the same type.
Duplicate Asset 
Select an asset from the hierarchy and click the 'Duplicate' button to make a copy of the asset. The entire configuration for the asset is duplicated, including child assets, custom attributes, mode, state and item links.
Delete Asset 
Remove assets from your hierarchy. If there are child assets or event history associated with any part of the asset hierarchy, the user will be warned that 'deleting this asset will also remove historical data'. This action cannot be undone.
Import/Export Asset 
An asset hierarchy can be exported and imported to another gateway using the import/export buttons. This utility works the same as the 'Duplicate Asset' in that the entire configuration for the asset will be exported.
Move, Duplicate or Delete an Asset
- Move: drag the asset onto its new parent, and confirm. You can move or rename an asset at any time, even while it's running: its history is stored against its ID, which never changes.
- Duplicate: select the asset and click Duplicate. The copy has the whole setup, including child assets, custom attributes, and mode, state and item links. It's the quickest way to add a line like one you already have.
- Import / Export: copy an asset and its setup to another gateway.
If the asset has child assets or recorded events, Kanoa warns that deleting it also removes its historical data. This can't be undone.
Everything Else an Asset Needs
The asset editor holds the basics. The rest of an asset's setup lives in these places, most of them on the tabs of Configuration → Ops → Assets:
| Setup | What it decides | Where |
|---|---|---|
| Modes | What the asset is meant to be doing: Production, Idle, Changeover, Maintenance | Linked to the asset on the Modes tab |
| States | What the asset is actually doing, and every downtime reason an operator can pick | Linked to the asset on the States tab |
| Production rates | Which items the asset makes, and how fast | Configuration → Ops → Materials |
| Item states | The scrap and waste reasons for the asset | Configuration → Ops → Item States |
| Counters | The infeed, outfeed and waste counts the asset records | The asset's counters |
| Custom attributes | Fixed information about the asset, and the reserved ones that change Kanoa's screens for it | The asset editor |
| OEE targets | The thresholds that color OEE green, orange or red | The asset editor |
| Shifts | The shift pattern, inherited from the asset above unless set here | Ops → Scheduling → Shifts |
| Dynamic attributes | Values that change over time, such as a recipe or a room humidity | Configuration → Ops → Dynamic Attributes |
| Measures | Process values collected and summarized, such as a temperature | Configuration → Ops → Measures |
| Tooling | The molds or dies the asset runs with, and their rates | Configuration → Ops → Tooling |
| Data interface tag | How the asset's PLC signals reach Kanoa | The asset's tag in the Kanoa tag provider |
Connecting an asset's data interface tag to the PLC is done in the Ignition Designer, so it's covered in Developer Training, not here.
Reference Materials
Modes - What an asset is meant to be doing, and how modes are linked to assets.
A mode defines the intended operation of an asset. The mode is typically set by the schedule or manually set by the operator, but can also be set via a mode tag when the asset is configured as 'OEE_Enabled'. Modes are used for scheduling assets using the Operations Scheduler in Kanoa Ops. This tool allows for the planned assignment of modes to various assets, ensuring that each piece of equipment is in the correct mode for its intended operation at any given time. In addition to being scheduled, Modes can also be manually controlled via the Line Operation screen. This feature enables operators or supervisors to dynamically adjust the mode of an asset based on real-time operational needs or changes in the production environment.
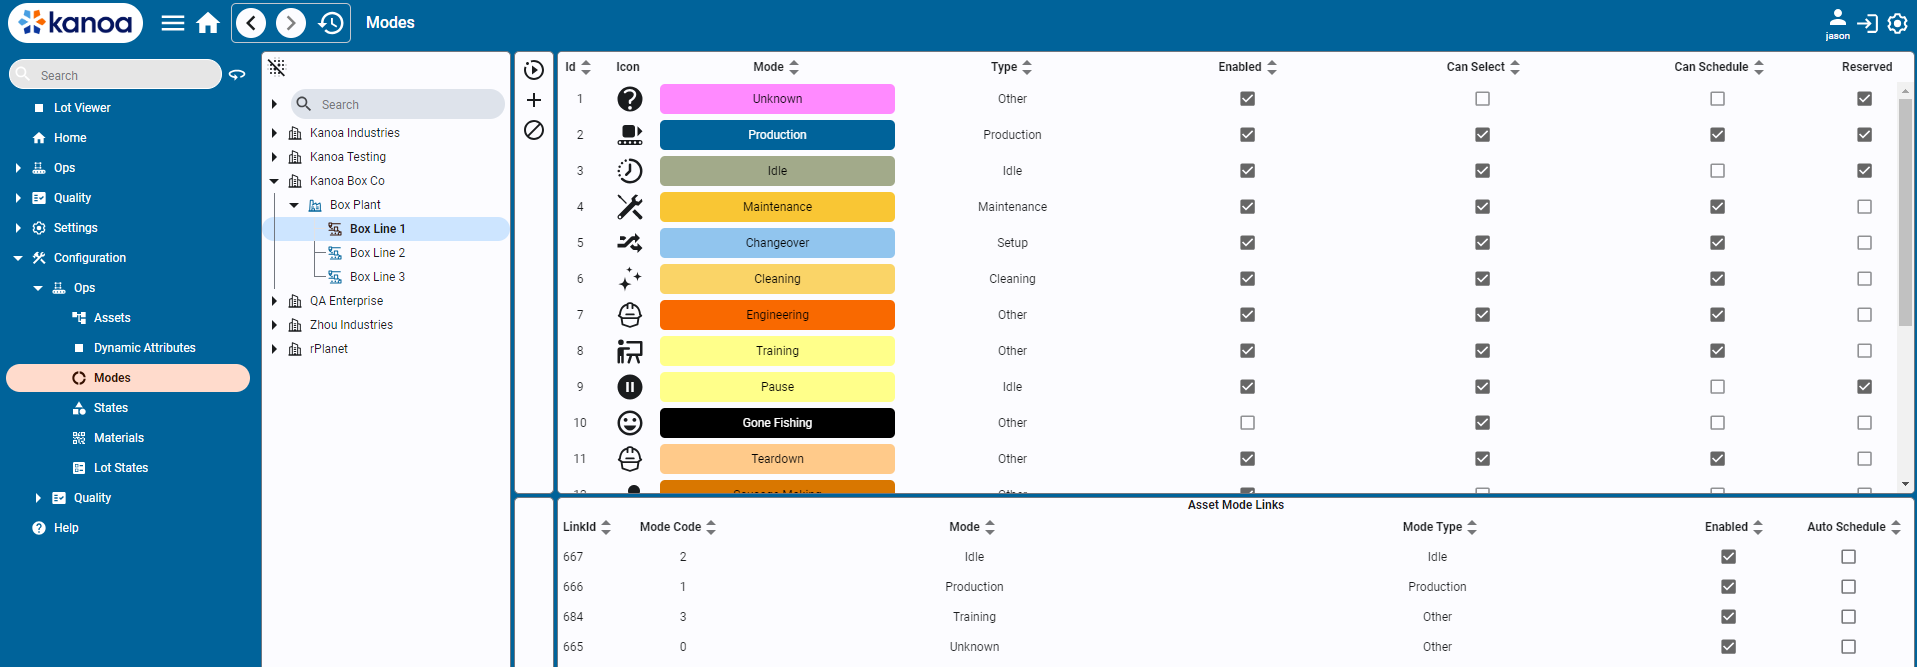
Modes
There are reserved modes predefined by the system such as 'Unknown', 'Idle', 'Production', 'Changeover', 'Maintenance'.
- Unknown: Serves as a catch-all state for uncertain scenarios or unclassified states of the asset.
- Production: The primary mode where assets are actively producing products. This mode indicates readiness for production and active engagement in the manufacturing process.
- Idle: The default state for an asset when it is not actively working but is available to produce. It represents a standby or waiting condition.
- Changeover: Used during the transition between different production runs. It covers setup activities, cleaning, and other preparatory tasks needed to switch products or start production.
- Production Delay: Used purely by analysis to determine how much time an asset has been delayed when scheduled to be in production. It is determined by the asset being set to a production mode, but no workorder or product has been selected.
New modes can also be created and associated with an asset. This is where you can customize the application to suit your manufacturing process. The mode indicates the production context of an asset and is an important aspect of how utilization and production performance analytics are determined.
Mode Types
Mode types are used to categorize modes. Mode types cannot be modified and are pre-defined by the system. The important mode type is 'Production' as only asset count and state events that occur during modes of type 'production' are included in production anaylsis. Mode types however are used along with modes to provide insight into asset utilization, in terms of 'how much time do my assets spend idle available for additional capacity compared to changeover, or setup, or CIP or maintenance.
Mode Types consist of....
- Cleaning
- Idle
- Maintenance
- Other
- Production
- Setup
Configuring Modes
Adding & Editing Modes

- Name: Name of the mode. Mode names must be unique.
- Type: Select the mode type for this new mode.
- Enabled: Indicates if the mode is active and usable within the system.
- Can Select: Determines if an operator can set an asset to this mode from the asset operation screen.
- Can Schedule: Determines if an asset can be scheduled to be in this mode.
Linking Modes to Assets
Once created, modes are linked to assets. Each mode is assigned a unique mode code. While the value used for a mode code is not important, it must be unique for the asset modes. If the mode for an asset is to be set via a plc tag, then the mode code defined should match between the PLC and MES.
- Select asset or assets from the asset tree.
- A list of modes assigned to the selected assets will appear in the bottom pane showing the mode link id and mode code.
- To link a mode to an asset, select one or more modes and click the 'Link' button. The mode will appear in the bottom pane.
- Assign a numeric mode code for the asset mode.
Auto-Schedule
By default, a mode will have the 'auto-schedule' bit set, which allows the scheduler to set the asset to this mode when scheduled and the asset is currently in
an 'idle mode. To clear the auto-schedule bit, simply double-click in the 'Auto Schedule' column and set to false.
Unlinking Modes from Assets
Modes can be unlinked from assets using the unlink option available on the screen. If event history exists for a mode, the system will not allow you to remove the link. It will instead be disabled.
States - What an asset is actually doing, and linking states to assets.
While Modes represent what an asset is supposed to be doing, states show what the asset says it was actually doing.
States are crucial for accurately understanding the availability component of OEE (Overall Equipment Effectiveness). They provide essential insights into:
- Actual running times
- Instances and reasons for unplanned downtime
- Categorization of downtime for analysis and improvement
States help in capturing and reporting the true operational status of assets, playing a vital role in efficiency analysis and operational optimization.

States
There are reserved states predefined by the system such as 'Running', 'Off-line', 'Idle', 'Faulted'
Offline: Typically used with a state code value of 0 to indicate that the asset is powered off. It doesn't have to be 0, but modbus connections tend to return 0 in a powered off state.
Running: Indicates that the asset is operating as expected.
Idle: Indicate asset is not currently running and no faults exist.
Faulted: Indicates a fault or error, suggesting a breakdown or malfunction.
New states can be created and will generally align with the machine states or fault codes expected from the target asset.
State Types
State Types are used to categorize the state. State types cannot be modifed and are pre-defined by the system.
State Types consist of....
- Running
- Planned Downtime
- Unplanned Downtime
Categories
Categories are used solely for analysis. You can define any category via the drop down by typing in the name of a new category and selecting 'create'. Examples of categories may be 'quality', 'electrical', 'mechanical' where you would want to analyse your downtime to see how much was related to say quality issues,
Asset Group
This field is simply to classify certain states as say being specific to a drill press, reactor or filler. It is optional and can be left blank.
Configuring States
Adding & Editing States

- State Name: Name of the state. State name must be unique
- State Type: Select the state type, Planned Downtime, Unplanned Downtime, or Running
- Category: Select a category for this state. Optional, can be left blank.
- Asset Group: Specifies an asset group to which the state applies. Optional, can be left blank.
- Enabled: Indicates if the state is active and available for use in the system.
Linking State to Assets
Once created, states can be linked to assets. Each state is assigned a unique state code. The state code should match what will be set by the asset via the plc tag.
- Select asset or assets from the asset tree.
- A list of states assigned to the selected assets will appear in the bottom pane showing the state link id and state code.
- To link a state to an asset, select one or more states and click the 'Link' button. The state will appear in the bottom pane.
- Assign a numeric state code for the asset state.
Unlinking States from Assets
States can be unlinked from assets using the unlink option available on the screen. If event history exists for a state, the system will not allow you to remove the link. It will instead be disabled.
Production Rates - Which items an asset makes, and how fast.
The Production Rates tab provides a method for linking which items (products) can be produced on which assets. The Item asset linker popup provides a fast way to link multiple assets with multiple items.
Once you have linked which items can be produced on which assets, you can then edit the production rate information that defines how we determine if an asset is under or over-performing in terms of OEE Performance.

To edit one or more item product rates, click the  button.
If you have selected multiple items, you can affect just one field value, such as Std Rate, without affecting any of the other item fields.
This is useful for performing a bulk update to standard rates or units.
- Standard Rate: The theoretical or expected speed at which the asset should process material. It uses the infeed units.

In the above example, Bake Line 2 is expected to be able to process 60lbs per hour of the infeed material to make Rye Bread. The Standard Rate drives the OEE Performance calculation and should not be affected by any scrap generated which is why it is measured against lbs processed and not loaves produced.
Sometimes the standard rate set for an item running on an asset may be affected by other external factors such as crew size, inclement weather, moisture content of incoming material. To handle this, the standard rate can be modified and set at the time the asset is in production through the system.kanoa.event.assetOperationChange() system function.
- Scheduled Rate: The expected asset rate to process material based on historical OEE data.
In the example above, we would actually expect to process 40lbs per hour due to data supporting the average amount of downtime and scrap generated when running this product on this line. Schedule Rate is used whenever a production order is added to the schedule to automatically determine how long we estimate it will take to complete a production order.
- Period: The timeframe for the rate. Can be 'Minute' or 'Hour'. For batch processes where the process time is independent of quantity, such as a chemical reaction time, use 'TOTAL TIME'.
- Units: Units designation for infeed, outfeed, and waste.
- Package Count: The number of infeed units that equate to the outfeed units. Used to calculate OEE values when no infeed count exists.
Rates for a tool
On a machine that uses tooling, a run's standard rate usually comes from the mounted tool: its cycle rate times its parts per cycle (see Cycle Rates and Item Rates). When an item runs at a different speed with a particular tool, give it a rate for that tool here. Tool rates are listed under the machine's own rate for the item, with the tool in the Tool column; the machine's own rate says Machine rate there. The Tool column only shows when a listed machine uses tooling.
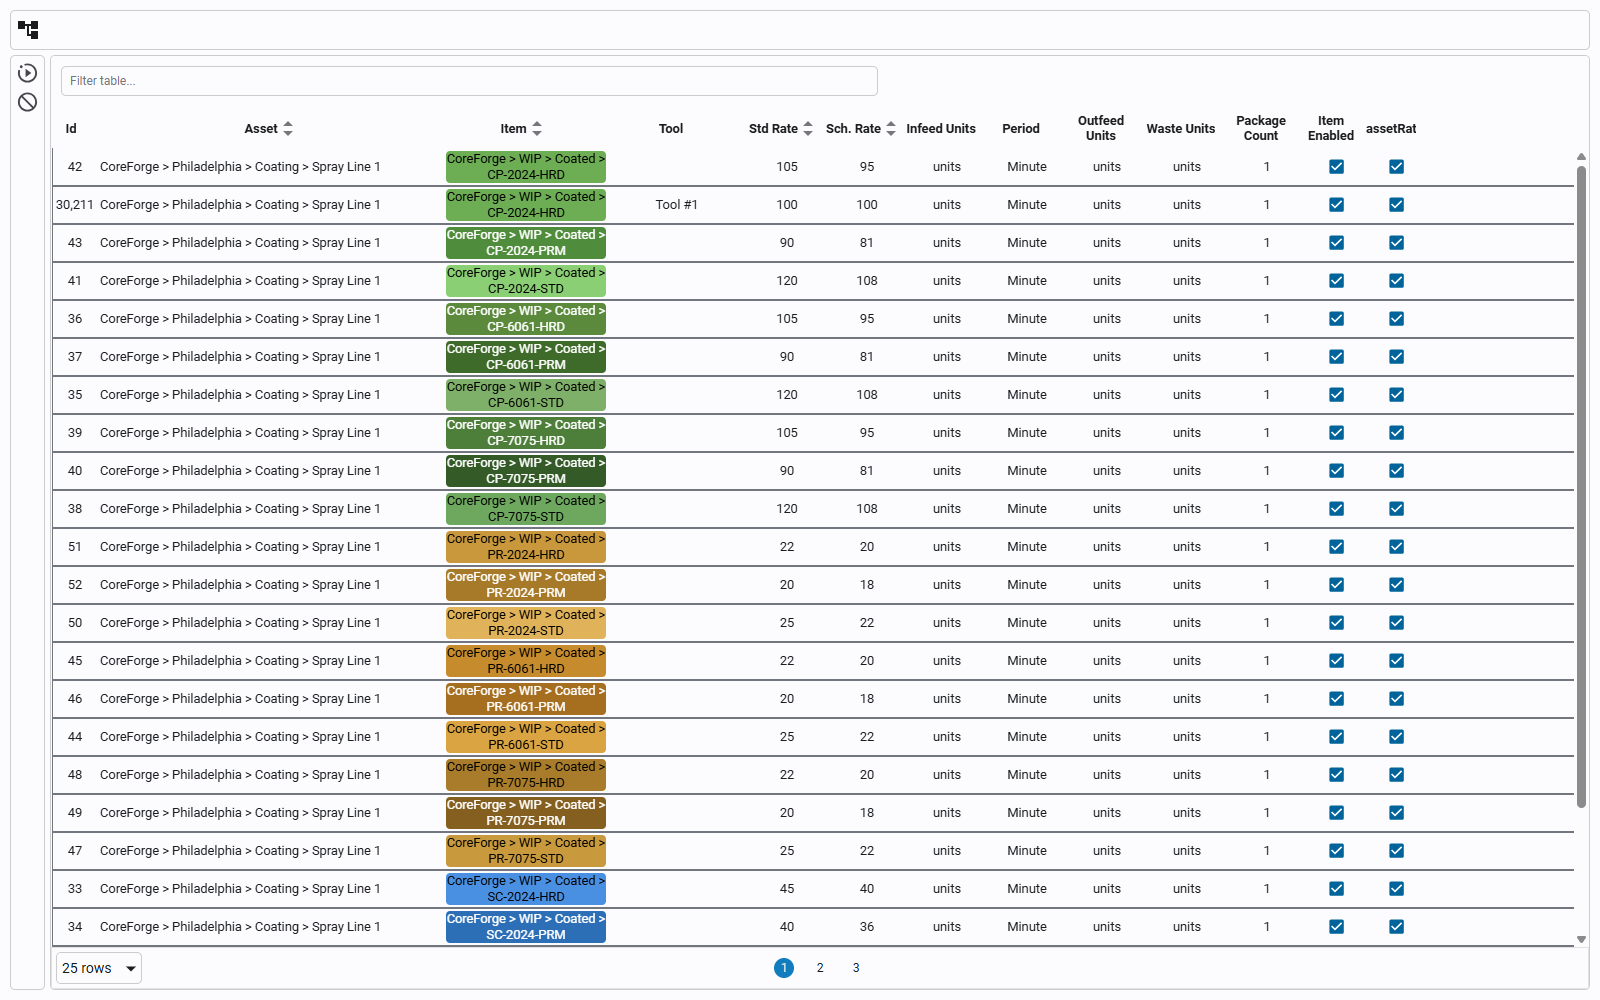
To add one:
- Select the machine's rate for the item (its Tool column says Machine rate) and click the edit button.
- In the editor, pick the Tool. The list has the tools that can be mounted on the machine, and None, the machine's own rate; a tool that already has a rate says (has a rate), and picking it edits that rate. A tool with no rate starts a new one from the machine's rate's units and period, and a hint says what the tool's cycle rate already gives the item, so you can tell whether you need a rate here at all.
- Enter the standard rate (and schedule rate) and click Save.
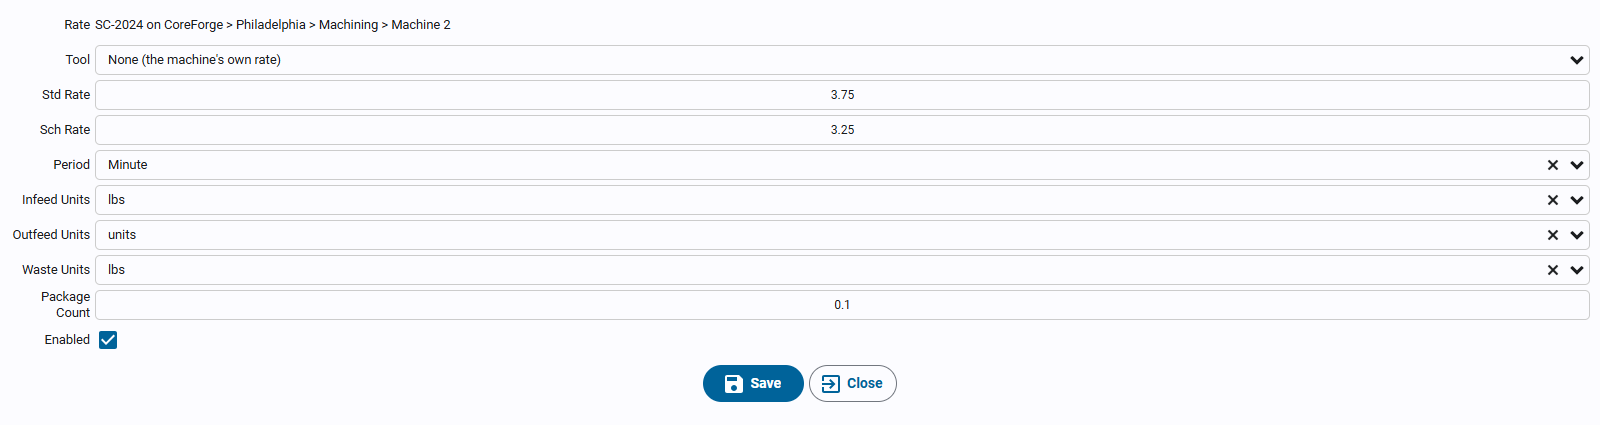
A tool rate is only for the machines in the tool's site, and only for machines that use tooling.
Item States - Scrap and waste reasons, linked to assets.
An item state is a classification applied to count events. In Kanoa Ops, the most common use is waste reason coding: a waste count tells you how much waste occurred, and an item state tells you why. For example, a packaging line might record waste for reasons such as Bad Coating, Insufficient Coating, Damaged Parts, Cosmetic Defect, or Incorrect Item. This gives the quality component of OEE much more detail than a simple waste count. This can be used by operators to code scrap reasons or when connected directly to a plc, to automatically set bottles kicked off a bottling line for say 'Low fill level' or 'Missing bottle cap'. It can also be used to differentiate between say 'First Pass' and 'Rework' on infeed counts.
Categories, counter types, and links
- Categories organize item states into a hierarchy, just as state categories do for downtime.
- Counter type association: item states can be associated with counter types. For waste coding, associate them with waste count events, which tells Kanoa these reasons are appropriate when recording waste.
- Linking: like states, item states can be linked to the assets or items where they apply, so operators don't see irrelevant waste reasons on unrelated assets.
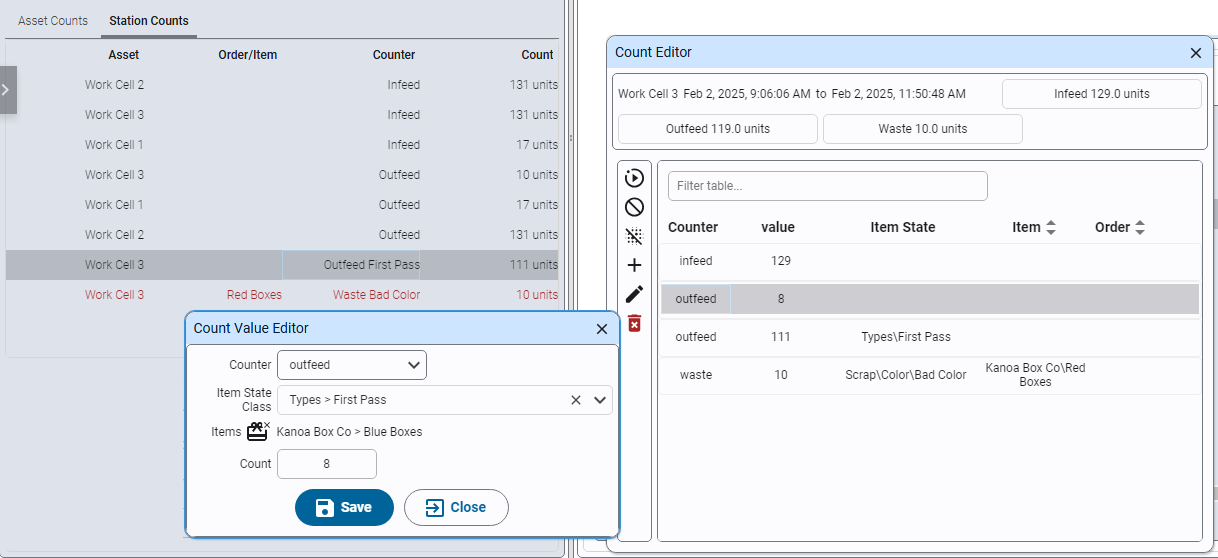
Items States are configurable via the Configuration > Ops > Item States

Counters - The counts an asset records.
Counters are the entry point for bringing production counts into Kanoa MES. By default, an infeed, outfeed and waste counter are automatically generated when an asset is 'OEE Enabled'. See Data Interface Tag
Creating Counters
Additional counters can be added via the 'Counters' tab on the Asset Configuration screen (Configuration > Ops > Assets).
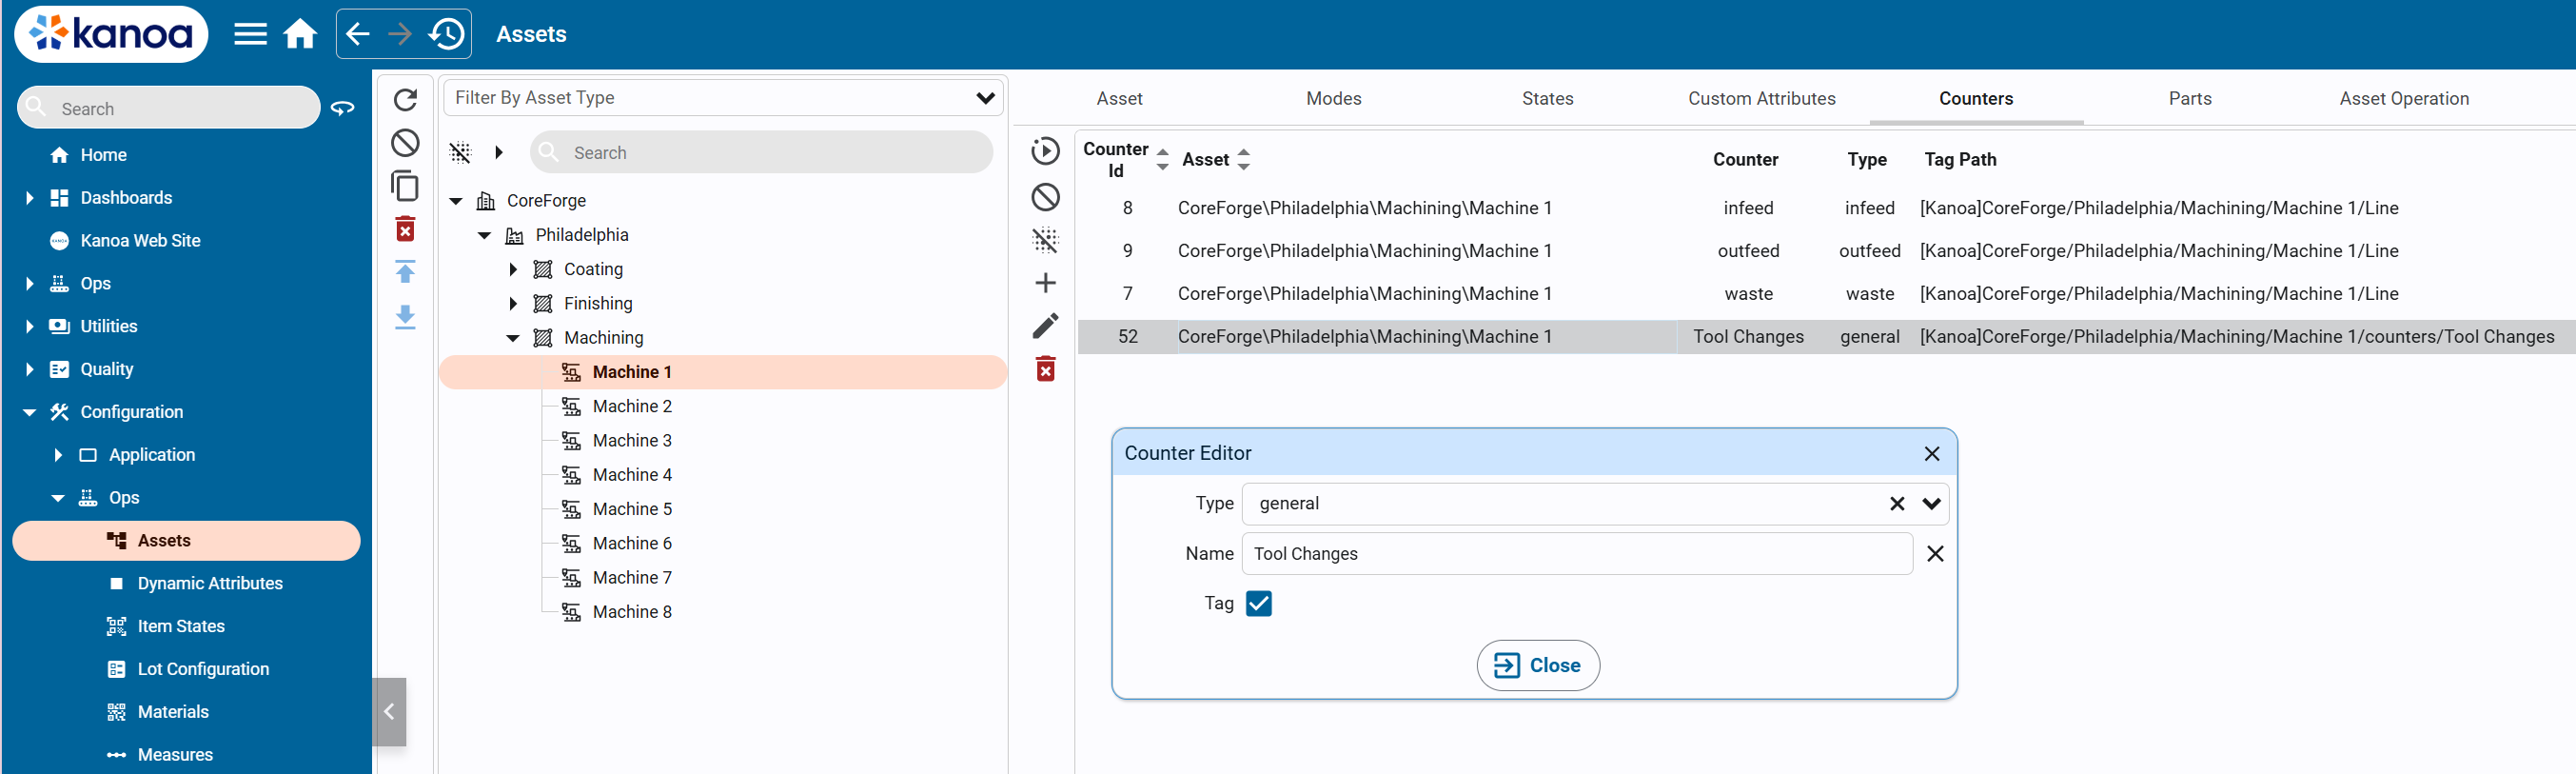
This provides a mechanism for adding additional infeed, outfeed and waste counters or general counters. General counters can be used to capture counts such a bottle tops that do not affect the OEE of an asset.
By selecting 'Tag', an instance of the counter UDT is created under the asset in the 'counters' folder. This can then be connected to a plc data source. Counters do not need to be wired to a data source, they can be created and counts captured via the system.kanoa.event.addCounterEvent() function
Custom Attributes - Fixed asset information, and the reserved attributes.
Custom Attributes store static properties for an asset (and can also be set for material items). They can be set in the asset configuration screen or through scripting. An example use case for a custom attribute would be to store the asset name used by ERP to link the assets between different systems.
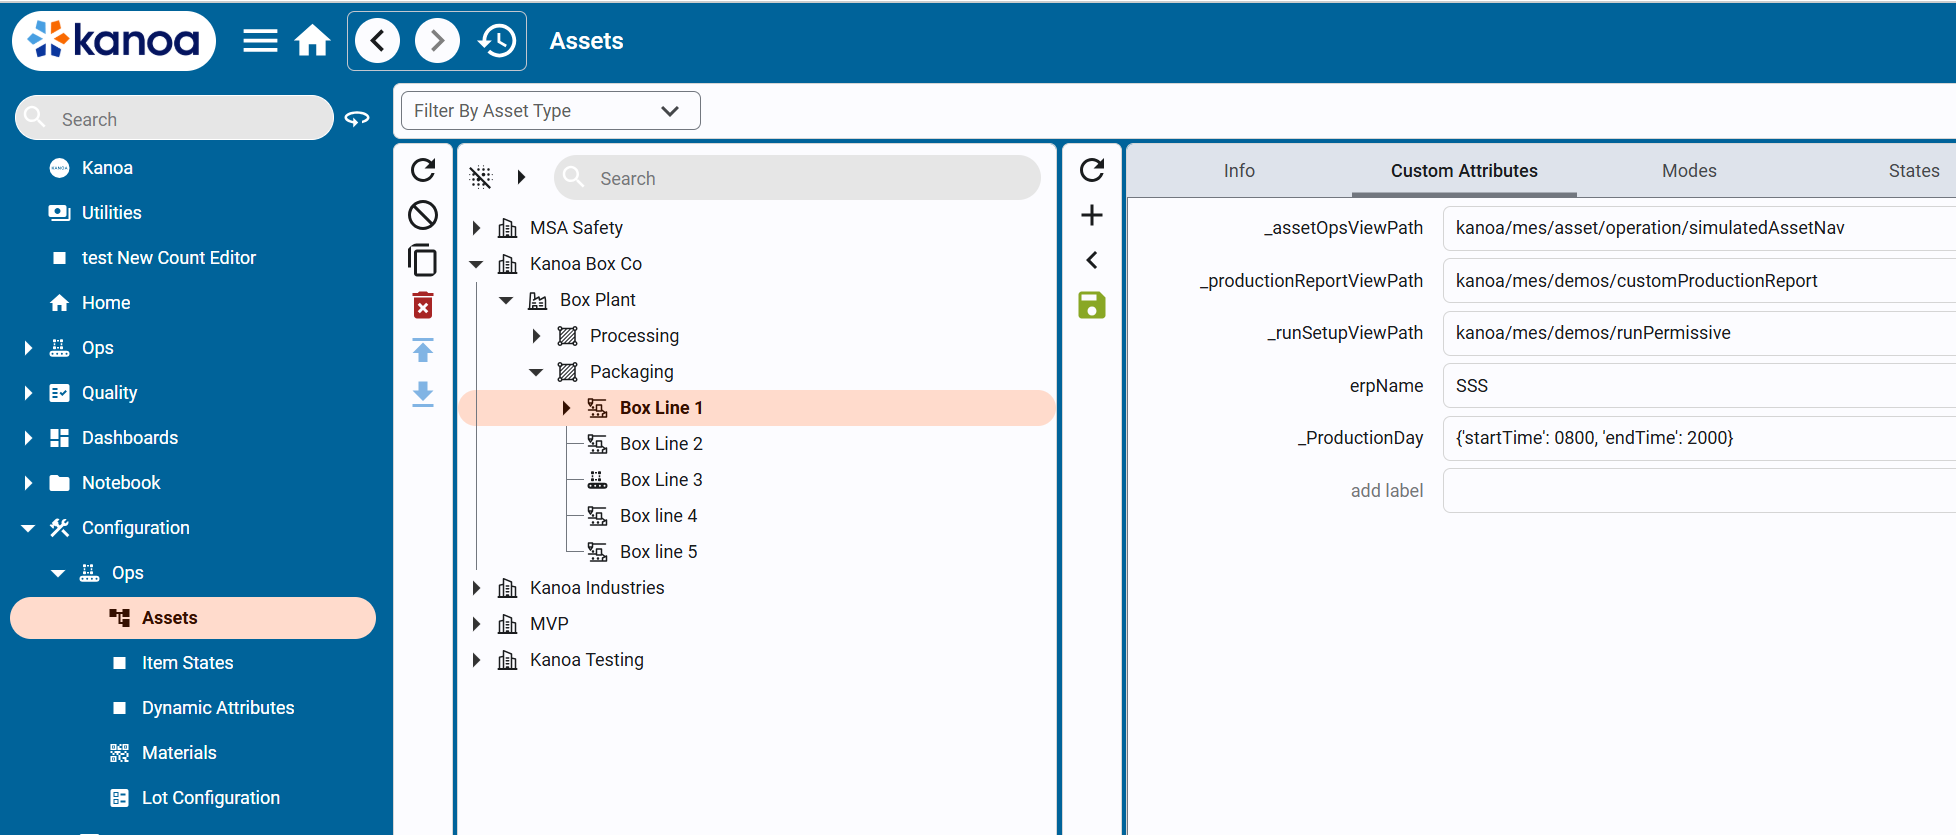
Custom attributes are stored in the mes.assetAttr database table. They are linked to an assetId and store the value as a string. In this way, you can use a custom attribute to store whatever data type you want including dictionaries—you would just need to encode/decode it. In the case of storing a dictionary, use system.util.jsonEncode() / system.util.jsonDecode() system functions.
Reserved Custom Attributes
We use custom attributes throughout the Kanoa MES application to change behavior based on asset selection. Reserved custom attributes have an underscore at the beginning of them. You are welcome to use the reserved custom attributes to affect the behavior of the application in specific ways.
_ProductionDay
This reserved custom attribute allows you to customize what the date selector view returns for start and end times when an assetPath is provided to the date selector. This attribute can be set at any level of the asset tree and assets below it will adhere to it. Different times can be set for different assets. If no value is found for _ProductionDay, the date selector will default to midnight for the date range selected.
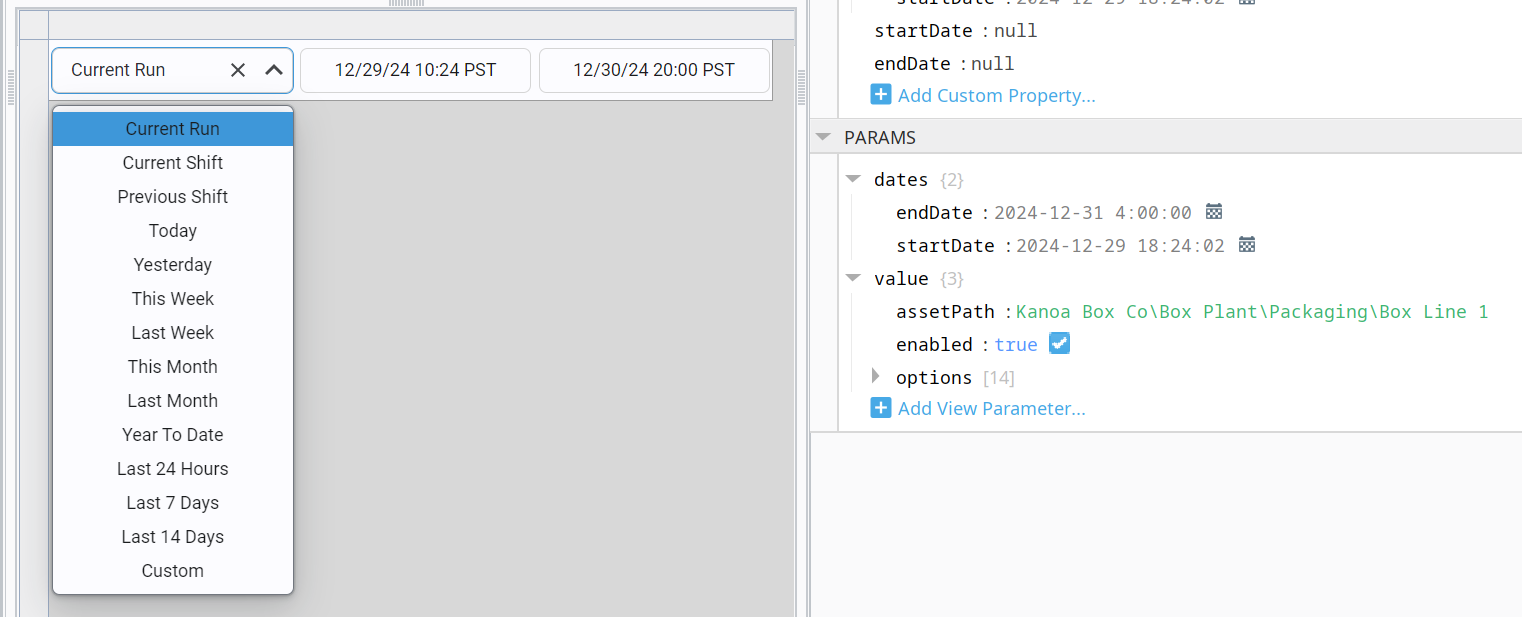
This reserved custom attribute value is stored as an encoded dictionary with key/value pairs of 'startTime' and 'endTime'.
{'startTime': 0700, 'endTime': 1700}
_assetOpsInfoPanelViewPath
The left-hand panel of the Operation Screen can be set to a custom view. By default, the 'kanoa/mes/asset/operation/assetInfoPanel' view is used for this panel. We also provide 'kanoa/mes/asset/operation/assetInfoPanelWorkCell' that was built for a line that has work cells underneath it.

This reserved custom attribute value is stored as a string and expects the viewPath.
_assetOpsViewPath
The right hand panel of the Operation Screen can also be set to a custom view. By default, the 'kanoa/mes/asset/operation/defaultNav' view is used for this panel. We also provide 'kanoa/mes/asset/operation/assetOperationPanel' that provides for dashboards to be used to further customize what a user sees when selecting a specific asset.
This reserved custom attribute value is stored as a string and expects the viewPath.
_productionReportViewPath
When a value is found for this reserved custom attribute, a link to a custom production report view will be visible to the user when viewing a certain asset.
This reserved custom attribute value is stored as a string and expects the viewPath.
_runSetupViewPath
When an operator starts a production run from the Run Control screen, you can force a custom popup to prompt pre-run checks (e.g., confirming labeler setup).

This reserved custom attribute value is stored as a string and expects the viewPath.
OEE - How OEE is worked out, and its color thresholds.
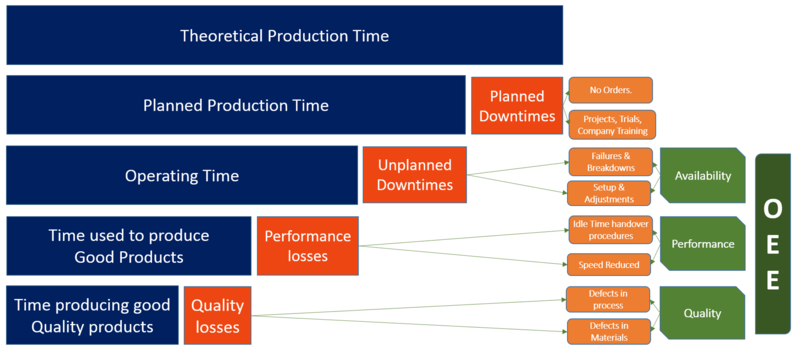
Overall Equipment Effectiveness identifies the percentage of manufacturing time that is truly productive. An OEE score of 100% means you are manufacturing only good parts, as fast as possible, with no downtime.
Fair warning though, you can get the same exact OEE number for entirely different utilization scenarios.
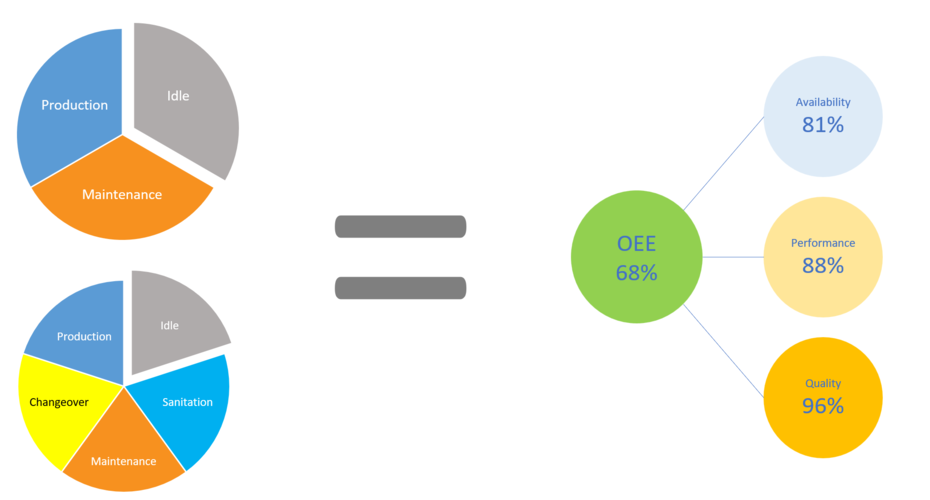
OEE is often considered meaningless without utilization context. To address this, many implementations stretch OEE to cover 100% of time, categorizing idle time as unplanned downtime. But is this the best approach? The Goal says it's ok to have local inefficiencies; idle time allows for more capacity planning. OEE should focus on how well we operate when we are expected to operate, but utilizing the assets have efficiently may be a bigger problem than how well they run during production. Reducing changeover, setup time, or maintenance may have a greater impact on your bottom line than reducing scrap or rework. This is not to say OEE is not important, just that it should be your only focus.
OEE Calculation
OEE is a widely accepted lean manufacturing standard, and extensive resources are available online. Here, we’ll focus primarily on how it is calculated and how it can be customized.
The term OEE was invented in the 1960s by the creator of the Total Productive Maintenance system, Seiichi Nakajima. OEE is expressed as a percentage from 0 to 100, where an OEE score of 100 percent would indicate that a manufacturing line or cell was producing only good parts at the anticipated production rate with no unexpected stops.
OEE is calculated by multiplying Availability * Performance * Quality
Availability
Availability = runtime / (runtime + unplanned downtime)
When an OEE_Enabled asset is in production mode, the amount of time the asset state is in a 'running' type state compared to an 'unplanned downtime' type state is pulled from the mes.stateEvent table to calculate Availability.
Planned downtime events such as a 'Clean In Place' step are excluded from the availability calculation.
Refer to the Asset States section of the Asset Configuration page for more info on setting up asset states and modes.
Performance
Performance = infeed count / (infeed rate * runtime)
Performance looks at infeed count and runtime, not outfeed count and total time as downtime and scrap would then skew the performance metric. Performance should only indicate processing speed issues.
If no infeed count is captured or entered for the asset, it's calculated from the outfeed and waste counts. See Calculated Counts.
The infeed rate is taken from the standard rate set for the item (material) when it is processed on the asset. The standard rate is set in the Materials Production Rate screen. Refer to Materials Configuration section of the help for more details.
Sometimes the standard rate set for an item running on an asset may be affected by other external factors such as crew size, inclement weather, or moisture content of incoming material. To handle this, the standard rate can be modified and set at the time the asset is in production via the system.kanoa.event.assetOperationChange() system function.
Quality
Quality = (infeed count - waste count) / infeed count
To be able to provide a 'Quality' metric for OEE, we're going to need at least two counts. It can be infeed and outfeed, outfeed and waste or infeed and waste. If only one count is provided, the Quality metric will default to 100%.
Calculated Counts
When a count isn't captured or entered for the asset, it's calculated from the other two:
- Infeed = outfeed count × package count + waste count
- Outfeed = (infeed count - waste count) / package count
- Waste = infeed count - outfeed count × package count, or 0 when only one count is provided
The package count is the number of infeed units in one outfeed unit, set on the item's production rate for the asset. It's 1 when not set, so when infeed and outfeed are in the same units, infeed = outfeed + waste.
Color Coding OEE
Wherever we show OEE Analytics, the metrics are color-coded in green (good), orange (warning), red (bad). The thresholds for setting the coloring are configured in the Asset Configuration screen. Refer to Asset Configuration for more details.
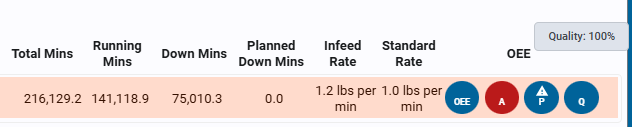
Modifying OEE
We're not actually suggesting you modify OEE because it is a standard and bear in mind that OEE is math, if you use it the way it was intended, it can be quite useful in planning.
Example: Using OEE to Estimate Order Completion If the average OEE for an asset is 67% and the standard deviation is fairly low, you can use this number to determine how long it will take to complete an order. For example, Order XYZ requires 10,000 cases of Product A. With a Standard Rate of 200 cases per hour and an OEE of 67% (due to downtime and scrap), the actual expected production rate becomes: Standard Rate x OEE = 134 cases per hour Total Estimated Order Time = 10000 Cases / 134 cases per hour = 74.6 hrs.
Having said all that, the data points needed to determine OEE (runtime, downtime, std Rate, counts etc.) are exposed by our system functions.
If you really want to change the way OEE that is returned, you can see how we calculate it in our stored procedures. We recommend making a copy of the stored procedure and using your own version within the application, as our procedures may be updated periodically.
Shifts - Shift patterns, and how assets inherit them.
Watch Scheduling Shifts Tutorial
Manage personnel shifts across your entire enterprise, whether at the plant level or for specific assets.
Overview
A shift is a planned operating time window for an asset or group of assets, for example Day Shift, Evening Shift, Night Shift, Weekend Shift, or Manual Pack Shift. Shifts are used for reporting and analysis.
Shifts are independent of production, they don't create, start or stop production runs or store production quantities. They provide time windows that Kanoa uses when analyzing production data, so reports can answer questions such as: How much did we produce on Day Shift? Which shift had the most downtime? What was OEE by shift?
Shifts are stored separately from production events. Kanoa combines production, count, state, and shift data at query time, so the same production events can be analyzed across different time windows without duplicating data.
Shifts are inherited through the asset hierarchy. Typically you configure shifts at the site level, let areas and lines inherit them, and override specific assets only when needed. This reduces repetitive scheduling configuration.

Features
Site Time Zone
KanoaOPS provides support for enterprises with sites in different timezones. When a site is selected, the calendar will show the shift times in the site's time zone.
Inherited Shifts
Shifts can be created at the site, area, asset level. When an asset doesn't have a shift associated with itself, it will look up the asset hierarchy
for a shift. This means that you can create the shifts at the site level and all assets underneath will respect that shift. If an asset or area requires a different shift,
simply create the shift at that level. Once a shift is created at any level, shifts from higher levels will no longer be inherited at that level.
Complex Shift Rotation Patterns
We use the dateutil rrule object which offers a complete and fast implementation of the recurrence rules documented in the iCalendar RFC.
This makes the scheduling of repeating shifts very simple and pretty much identical to how it is done in Google Calendar, iCalendar and Microsoft's calendar.
To create, say, a four shift rotation pattern, simply create the schedule pattern for each week and set it to repeat every x weeks.

Filters
- Asset Selector: Click on the asset selector
 to select which assets the scheduled events are shown for.
- Display mode: Scheduled events can be shown on a calendar or as a list.
- Period: The calendar or list can display events by month, week, or day.
Adding Shifts
- In the calendar view, select the time you wish to schedule the shift for.
- Click
 button.
- Select the asset if it has not already been populated.
- Select the shift name. If the shift name does not exist, you can create it by typing the name of it in the dropdown and selecting 'create'.
- Click on the circle to choose a color for this shift.
- Set start and end times.
- For recurring events, click on the 'Does Not Repeat' link to edit recurrence options.

Note: Shifts do not need to repeat, but typically should for ongoing operations. User non-repeating shift entries for special one off shifts.
Editing Shifts
- In the calendar view, select the shift you wish to edit and click
 button.
Deleting Shifts
- In the calendar view, select the shift you wish to delete and click button. You can also use Delete key on you keyboard.
Dynamic Attributes - Defining them and linking them to assets.
Defining and Linking Dynamic Attributes
Dynamic Attributes are defined and linked to assets in the Dynamic Attributes Configuration page (Configuration > Asset Management > Dynamic Attributes by default). Dynamic attributes are defined in the left-hand 'Attributes' list.

Use the button to open the Attribute editor. Here you can create or delete dynamic attributes and folders.

To link an asset with a dynamic attribute, select the dynamic attribute in the Attribute Settings pane and click the  button.
Use the
 button to add a data source, pick the asset and enable.
Attributes can be deleted by selecting an attribute and clicking the button. Confirm deletion by clicking OK when prompted.
If the value for the dynamic attribute can be pulled directly from an asset, configure the Data Source settings. To add a new data source, click the button on the left.
Use the Asset Selector and Tag Browser to select the tag. Scale Factor and Ignore zero values parameters are specific to tag collector values, scaling the PLC value and preventing the storage of zero values if not required. Use the Enabled checkbox to enable or disable a data source.

Viewing, Creating, and Editing Dynamic Attribute Events
Dynamic Attribute Events are used to establish the dynamic attribute value at a given time for a specific asset. Attribute events can be viewed and edited through the Attribute Events page (Ops > Operations > Attribute Events by default).

Use the provided filters to select an asset and a dynamic attribute associated with that asset, and a time-range for which you want to see Attribute Events. Qualified users can then change the values and timestamps of previously recorded attribute events, add new attribute events, or delete attribute events.
Note that this is often considered an 'Administrative' screen where qualified, trained users are manually updating or adding data. For ease of use, consider integrating dynamic attributes into custom manual entry screens, as described in the sections below.
Measures - Collecting and summarizing process values.
The Measures feature allows you to capture, aggregate, and statistically analyze process measurements at scale. Rather than storing every raw sample, measurements are collected over a configurable window — by count or by duration — and summarized into a single database record that preserves key statistical properties.
How It Works
A measure is backed by a Tag UDT that collects incoming values in memory. Once the configured window is complete, the UDT computes a statistical summary and writes one aggregated record to the database.
Collection Window
You configure the window in one of two ways:
| Mode | Description |
|---|---|
| Sample count | Collect exactly N values, then aggregate |
| Duration | Collect all values over a time period (e.g. 5 minutes), then aggregate |
Aggregated Output
Each record (measure event) written to the database includes:
| Field | Description |
|---|---|
measureValue | Average of all samples in the window |
stdDev | Standard deviation of the samples |
minValue / maxValue | Observed range |
sampleCount | Number of raw values collected |
durationSecs | Seconds from the first sample to the last |
The SPC result isn't stored with the record: it's on the measure's tags (outOfControl and ruleViolations, see SPC Rules).
Use Cases
High-Frequency Sensors
A vibration or temperature sensor sampling at 100 Hz would generate millions of rows per day if stored raw. With a count-based window of 500 samples, storage is reduced 500× while retaining the statistical shape of the signal.
Shift or Batch Summaries
Use a duration-based window aligned to your shift length (e.g. 8 hours). Each shift produces one measure record capturing the process behavior for that period — suitable for OEE dashboards and trend reporting.
SPC Without Raw Data Retention
Each recorded event is one point on the measure's control chart. After every record, the UDT checks the latest events against the measure's configured control limits and sets its out-of-control flags, so you get SPC on the process without storing the raw samples.
Centerlining
Measures can be linked to a quality attribute (attributeId) from the attribute specification table. This allows a measure record to be compared against a golden-run baseline, supporting centerlining workflows where you want to know how far the current window deviates from optimal settings.
Multi-Asset Rollups
Deploy the same UDT across many assets. Because each record includes sampleCount, downstream aggregation (e.g. plant-wide averages) can be properly weighted rather than treating each window as a single data point.
Creating a Measure Definition
Measures can be defined in the Configuration/Ops/Measures page as well as via the measures api's.
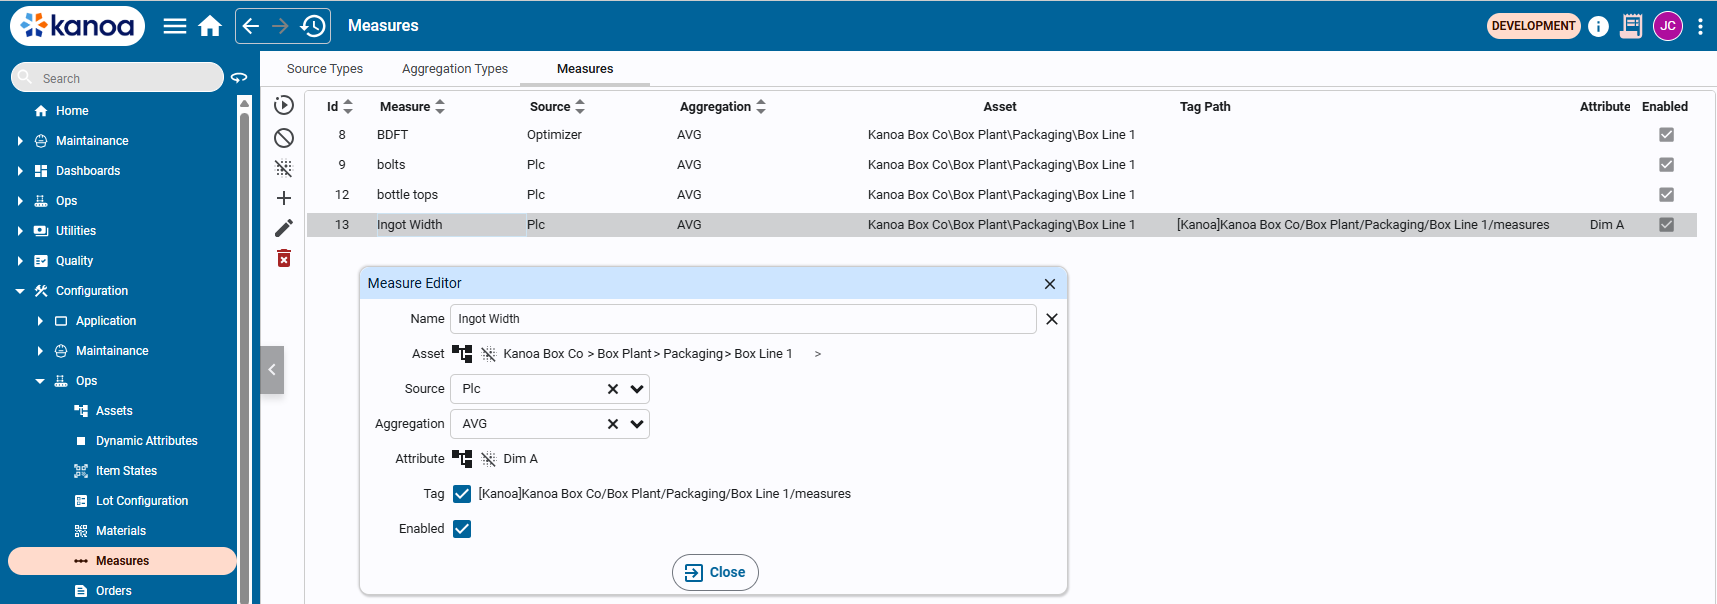
Measures require a name and an asset to be linked with. Data sources for where the measurement comes from i.e. PLC, can be configured and linked. Aggregations can also be defined and linked to determine whether the measurement is an average value, sum etc.
If SPC analysis is required to be performed on the measurement (requires a quality license), an attribute containing spec limits can be linked to the measurement. This enables centerlining comparisons in downstream reporting.
Creating the Measures Tag
By enabling the 'Tag' checkbox, a measure UDT instance will be created in a measures tag folder under the asset. This provides the ability to connect the data source to the measurement value tag.
The Measure tag UDT instance has the following settings:
| Parameter | Type | Description |
|---|---|---|
measureId | int | ID returned by the addMeasure() function |
maxSampleCount | int | # of measurement to collect before storing the measurement |
maxSampleDurationSecs | int | # of seconds between samples before storing the measurement |
outOfControl | bool | Set when the SPC check finds an out-of-control condition in the latest spcPoints recorded events |
ruleViolations | array | The violated rules' keys (for example WE4_8_same_side), from the same check |
spcCheckEnabled | bool | Set to true to enable the SPC check |
spcPoints | int | How many of the latest recorded events the SPC check and the Measure SPC Analysis chart use. Default 30 |
enabled | bool | Set to true to enable this measure |
update | bool | Set to true to store this measurement value ibn the database. This is automatically enabled when either the 'maxSampleCount' or 'maxSampleDurationSecs' threshold is reached |
value | float | This is the measurement value. Wire the UDT's value input to the tag you want to measure. The UDT will begin collecting values immediately when enabled is true. |
data | dataset | The samples collected for the next record. They're averaged into the record and cleared each time it's written |
spec | folder | Contains measure specification if applicable |
spec/attributeId | int | Id of the attribute linked to this measure |
spec/itemId | int | Id of the item currently linked with this measure |
spec/refresh | int | Updates the specification based on the attributeId, itemId, and assetId |
spec/lsl | int | Attribute spec lower spec limit |
spec/lcl | int | Attribute spec lower control limit |
spec/tgt | int | Attribute spec target |
spec/ucl | int | Attribute spec upper control limit |
spec/usl | int | Attribute spec upper spec limit |
SPC Rules
Each time a measure records an event (with spcCheckEnabled set), the UDT runs spcCheck() on the latest spcPoints recorded events, with both rule sets, and writes outOfControl and ruleViolations.
The events are judged against the measure's configured control limits: spec/ucl and spec/lcl from its linked attribute, centered on spec/tgt. These are the limits the Measure SPC Analysis chart draws, so the flags and the chart always agree. Sigma for the zone rules is (UCL - LCL) / 6.
If the measure has no configured UCL/LCL, the control limits are computed from the recorded events themselves. That's only meaningful once there are enough of them (20-25 or more) from a period when the process was stable, so configure the limits wherever you can.
Points on the same side of the target are a real signal, even inside the limits: a process that sits above its target trips the "on one side" rules.
The Label column is how the rules are shown in the Measure SPC Analysis popup and the notifications widget (from getRuleInfo()).
Rule Sets
| Value | Description |
|---|---|
'western_electric' | Western Electric rules only |
'nelson' | Nelson rules only |
'both' | Both rule sets combined (default) |
Western Electric Rules
| Rule | Label | Description |
|---|---|---|
WE1 | Beyond 3σ | 1 point beyond 3σ |
WE2 | 2 of 3 beyond 2σ | 2 of 3 consecutive points beyond 2σ on the same side |
WE3 | 4 of 5 beyond 1σ | 4 of 5 consecutive points beyond 1σ on the same side |
WE4 | 8 on one side | 8 consecutive points on the same side of the center line |
WE5 | 6 trending | 6 consecutive points trending in one direction |
WE6 | 15 within 1σ | 15 consecutive points within 1σ of the center line |
Nelson Rules
| Rule | Label | Description |
|---|---|---|
N1 | Beyond 3σ | 1 point beyond 3σ |
N2 | 9 on one side | 9 consecutive points on the same side of the center line |
N3 | 6 trending | 6 consecutive points trending in one direction |
N4 | 14 alternating | 14 consecutive points alternating up/down |
N5 | 2 of 3 beyond 2σ | 2 of 3 consecutive points beyond 2σ on the same side |
N6 | 4 of 5 beyond 1σ | 4 of 5 consecutive points beyond 1σ on the same side |
N7 | 15 within 1σ | 15 consecutive points within 1σ of the center line |
N8 | 8 outside 1σ | 8 consecutive points with none within 1σ of the center line, on both sides of it |
A point beyond a control limit is also reported as Above UCL / Below LCL, and beyond a spec limit as Above USL / Below LSL.
Chart Types
| Value | Description |
|---|---|
individuals | Individuals/moving range chart. Used when each measurement is a single value. Default. |
xbar | X-bar/range chart. Used when measurements are grouped into subgroups of 2–10 samples. Requires subgroupSize. |
Use individuals for most sensor and manual entry scenarios. Use xbar when your process naturally produces batches of samples (e.g. 5 parts per cycle) and you want to track subgroup means.
Real-time SPC
A measure can check its process as it runs: each time it records an event, it judges the latest events against the SPC rules and flags the measure when they break one. Operators see the alert on their dashboard straight away, and can open the chart behind it.
Measures are part of Kanoa Ops: without an Ops license (or trial), a measure keeps its samples but records no events. The real-time SPC check uses Kanoa's SPC functions, which are part of Kanoa Quality. Without a Quality license (or trial), measures still record their events, but the check doesn't run: outOfControl and ruleViolations keep their last values, no new alerts appear, and the gateway log says why (at most once an hour).
Turning It On
On the measure's tag (see Creating the Measures Tag):
- Set
spcCheckEnabledtotrue. - Set
spcPointsto how many of the latest events to judge (30 by default). - Link the measure to an attribute with control limits (UCL and LCL) and a target, so the events are judged against the limits you set rather than limits computed from the events themselves.
Each recorded event then writes outOfControl and ruleViolations on the measure's tag.
SPC Alerts on a Dashboard
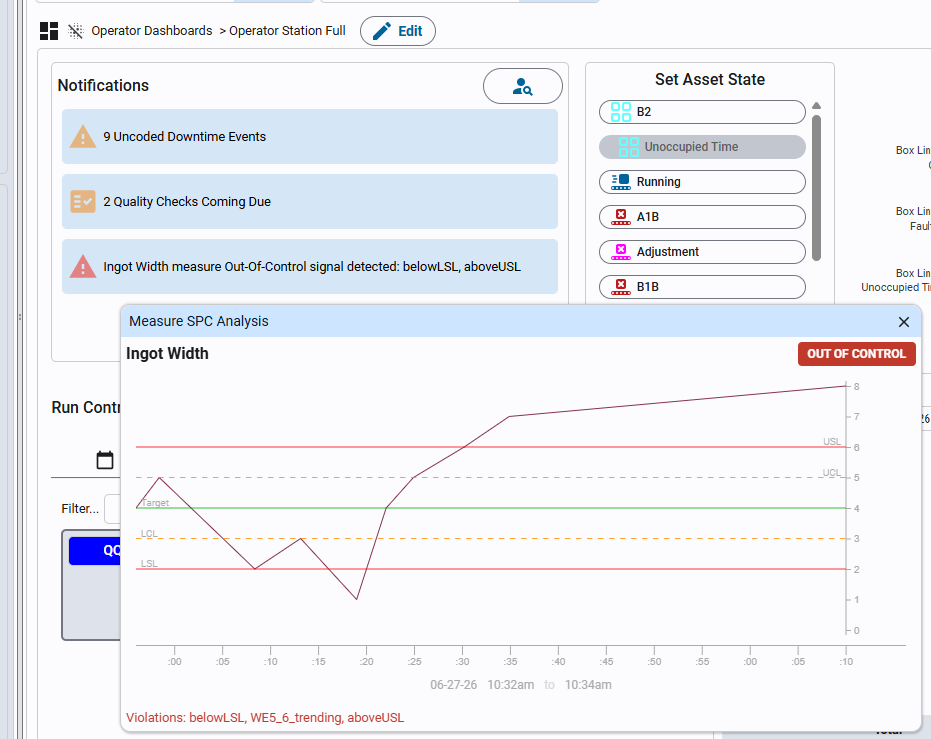
The Event Notifications widget shows SPC alerts alongside downtime, quality check and tooling notifications. It lists every measure on its asset, or on any asset below it, that is out of control, naming the rules it broke (for example "8 on one side, 6 trending"). It checks every 5 seconds, so an alert shows almost as soon as the event that caused it is recorded.
To add it:
- Open the Dashboard Editor and select the dashboard, for example the line's operator dashboard.
- Add the Event Notifications widget, from the Notifications category (see Adding Widgets to a Dashboard).
- Point it at the asset to watch: set its
assetPathparameter, or leave it empty to follow the dashboard's asset selector. A line or area shows the measures of every asset under it.
Measure SPC Analysis
Clicking an out-of-control measure in the Event Notifications widget opens the Measure SPC Analysis popup.
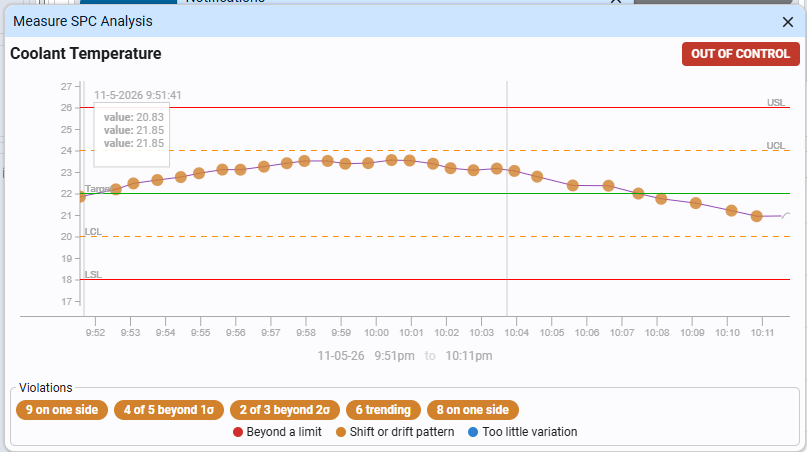
- Chart: the latest
spcPointsrecorded events (one point per record), against the measure's limit lines (LSL, LCL, Target, UCL, USL), with the samples still being collected for the next record drawn after them in gray. It updates each time an event is recorded, so it doesn't clear between records. - Highlighted points: every point in a violating run is marked in the color of its kind (a point in several runs takes the most serious): red for beyond a limit, orange for a shift or drift pattern, blue for too little variation.
- OUT OF CONTROL: shown when the check finds any violation.
- Violations: one pill per violated rule, colored by kind, with its readable label. Hover a pill to see what the rule means. The legend under the pills explains the colors.
The popup runs the same check as the measure's tags, on the same points and limits, so what it shows always matches outOfControl and ruleViolations.
Measures Analysis
The Measures Analysis view provides a multi-chart breakdown of aggregated measure data over a selected time range. It is designed to surface trends, distribution patterns, hourly variation, and sample count anomalies in a single screen.
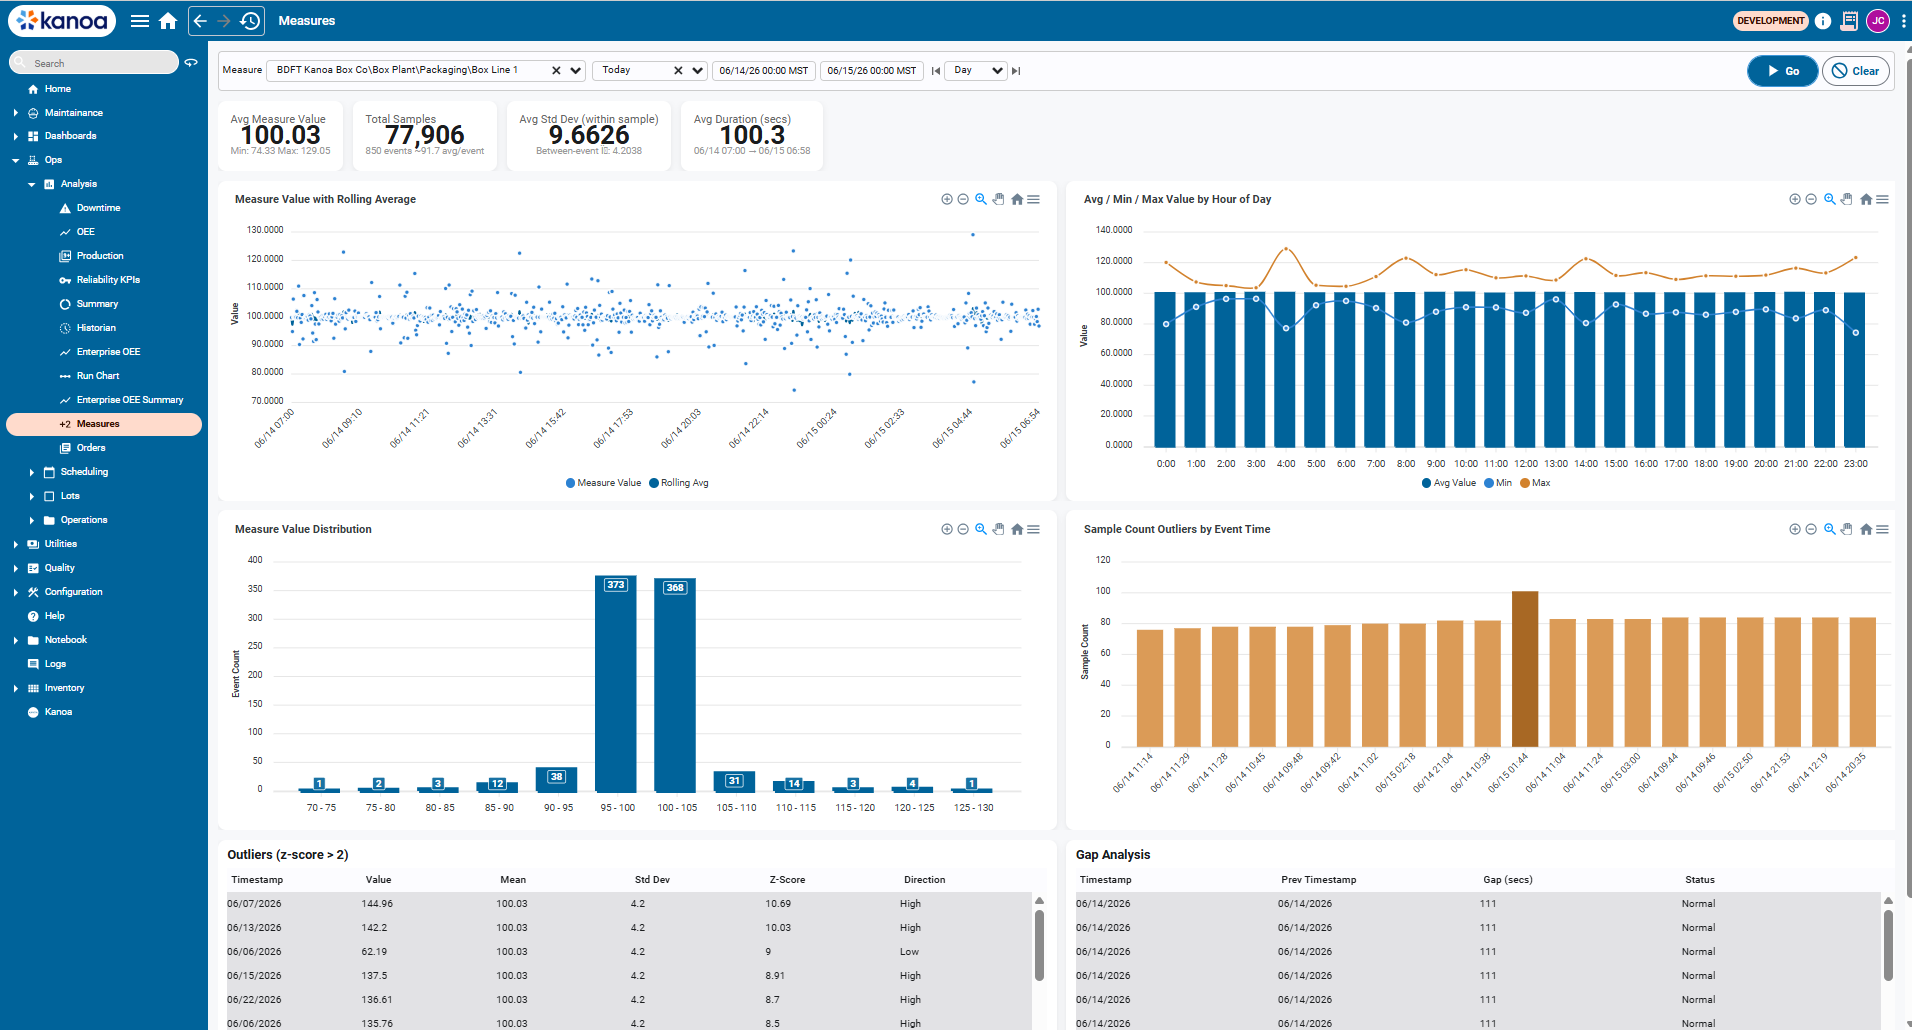
Filters
| Filter | Description |
|---|---|
| Measure | Asset-scoped measure to analyse (e.g. BDFT Kanoa Box Co\Box Plant\Packaging\Box Line 1) |
| Date range | Preset (Last Week, Last Month, etc.) or custom start/end timestamps |
| Granularity | Day / Shift / Hour — controls how rolling averages and hourly charts are bucketed |
Click Go to apply filters. Click Clear to reset to defaults.
KPI Summary Cards
Four summary cards appear at the top of the view.
| Card | Description |
|---|---|
| Avg Measure Value | Mean of all aggregated values in the selected range. Min and Max show the observed extremes across all events. |
| Total Samples | Sum of sampleCount across all events. Also shows total event count and average samples per event. |
| Avg Std Dev (within sample) | Average of the per-event standard deviation. Reflects within-window process variation. The between-event figure shows variation across events. |
| Avg Duration (secs) | Average collection window duration in seconds, with the full date span of the query shown beneath. |
Example
From the screenshot above (06/14/26 – 06/21/26, Box Line 1):
- 100.02 avg value across 532,439 total samples (5,932 events, ~89.8 samples/event)
- 8.9647 avg within-sample std dev, with a between-event std dev of 3.6711
- 100.6 s avg window duration
Charts
Measure Value with Rolling Average
A time-series scatter plot of every aggregated event value over the selected range. A rolling average line is overlaid to show the process trend.
Use this chart to:
- Identify drift or step changes in the process mean over time
- Spot isolated outlier events against the rolling trend
- Confirm process stability across shifts or days
Avg / Min / Max Value by Hour of Day
A bar + line combo chart grouping all events by hour of day (0:00–23:00). Bars show the average value per hour; lines show the min and max observed in that hour across the full date range.
Use this chart to:
- Detect time-of-day patterns (e.g. startup variation, shift changeover effects)
- Identify hours where the max consistently exceeds spec
- Compare average vs. worst-case behaviour by hour
Measure Value Distribution
A histogram bucketing all events by their aggregated value. Each bar shows the event count falling within that value range (e.g. 95–100, 100–105).
Use this chart to:
- Confirm the process is centred on the target value
- Identify skew or bimodal distributions that suggest a mixed process
- Quickly see how many events fall outside expected ranges
Sample Count Outliers by Event Time
A bar chart of sampleCount per event over time. Events where the sample count deviates significantly from the typical range are visually prominent as outliers.
Use this chart to:
- Identify events where the collection window captured an abnormal number of samples (sensor bursts, window timing issues)
- Spot gaps where sample counts drop unexpectedly (e.g. downtime, tag disconnection)
- Validate that window configuration is behaving consistently
A sudden spike in sample count (as visible in the example above around 06/16–06/17) can indicate a window that failed to flush on time and accumulated extra samples before writing. Cross-reference with the rolling average chart to see whether the value was also affected.
Outliers (z-score > 2)
A paginated table listing every event where the aggregated value deviated more than 2 standard deviations from the process mean.
| Column | Description |
|---|---|
| Timestamp | Date/time of the event |
| Value | Aggregated measure value for that event |
| Mean | Process mean across the selected range |
| Std Dev | Process standard deviation across the selected range |
| Z-Score | How many standard deviations the value is from the mean |
| Direction | High — value above the mean, Low — value below the mean |
Rows are sorted by Z-Score descending, so the most extreme outliers appear first. Rows highlighted in orange indicate events that also exceeded the USL or LSL.
Use this table to:
- Identify the most extreme process excursions and when they occurred
- Distinguish high-side from low-side outliers
- Drill into specific dates for root cause investigation
Gap Analysis
A paginated table showing the time gap between consecutive events, flagging windows where the gap was larger than expected.
| Column | Description |
|---|---|
| Timestamp | Date/time of the current event |
| Prev Timestamp | Date/time of the preceding event |
| Gap (secs) | Elapsed time between the two events |
| Status | Normal — gap within expected range, Large Gap — gap significantly exceeds the typical window duration |
Use this table to:
- Detect periods where measurement collection stopped or stalled (downtime, tag disconnection, network issues)
- Validate that the collection window is flushing consistently
- Identify missing data before using the analysis for reporting or compliance
A Large Gap alongside a spike in the Sample Count Outliers chart on the same date often indicates the window paused and then flushed a backlog of samples in a single event when collection resumed.
Data Interface Tag - How an asset's PLC signals reach Kanoa.
Watch Connecting To Data Tutorial
Kanoa Ops supports a variety of data connectivity options, making an extensible system that can grow to collect data from additional systems as adoption increases and requirements evolve. Machine Performance and OEE data can be collected via PLCs and automation equipment through Ignition's built-in OPC server or Industry 4.0 protocols like MQTT. Web APIs allow Kanoa Ops to integrate with business systems like ERP to automatically download material specifications and production schedules. When automatic data collection is not an option, Kanoa Ops provides manual entry solutions so that every single asset can be accounted for.
Whenever an asset is OEE Enabled, Kanoa creates an instance of the assetOEE tag UDT, named Line, in the asset's folder in the Kanoa tag provider. For example, CoreForge\Philadelphia\Machining\Machine 1 gets [Kanoa]CoreForge/Philadelphia/Machining/Machine 1/Line.
The assetOEE UDT instance is the standard interface between Ignition tag data and Kanoa Ops. It is used to:
- Receive real-time input values
- Trigger count events
- Trigger state events
- Trigger mode or production changes
- Provide live OEE data back to dashboards and screens
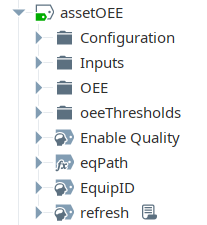
| Folder / tag area | Purpose |
|---|---|
| Root-level tags | Asset identity and path information |
| Configuration | Counter IDs, the user events are recorded against, and initialization |
| Inputs | Incoming data used to create Kanoa events |
| OEE | Live outputs for OEE, counts, state, and production context |
| OEE Thresholds | Threshold values used by dashboards and visual indicators |
For the other Kanoa tags and UDTs, see Kanoa Tags.
Root-Level Tags
EquipID, the asset ID from Kanoa, and eqPath, the asset's path in the hierarchy, together connect the Ignition tag instance back to the Kanoa asset record.
| Tag | Purpose |
|---|---|
EquipID | The asset's Kanoa assetId |
eqPath | The asset's Kanoa path, worked out from the tag's folder (CoreForge\Philadelphia\Machining\Machine 1) |
refresh | Set to true to look up EquipID again from eqPath, for example after renaming or moving the asset |
Enable Quality | When true, product, shift and mode changes on this asset trigger Kanoa Quality checks |
MQTT Path Parameter
The assetOEE UDT has one parameter, MQTT path (MQTTPath). Every tag in the Inputs folder is a reference tag bound to {MQTTPath}/Inputs/<tag name>, so setting this one parameter links the whole Inputs folder to another source tag structure: an assetInputs instance, an MQTT folder or a PLC UDT with matching Inputs tags. For example:
[Kanoa]CoreForge Sim/Site/Machining/Machine 1/assetInputs
Leave it blank to set each input tag's source individually instead.
Configuration Folder
The Configuration folder holds values that support event creation and UDT behavior. You generally shouldn't modify it during normal configuration, but it's useful for debugging, verifying counter IDs and refreshing values when troubleshooting.
| Tag | Purpose |
|---|---|
infeedCounterId, outfeedCounterId, wasteCounterId | The asset's infeed, outfeed and waste counters. They are created, or looked up if they already exist, when the tag starts |
userId | The user count and state events are recorded against (the tagChange user) |
initializeTags, refresh | Run on startup to load userId. Set refresh to true to load it again |
Inputs Folder
The Inputs folder is where the asset is connected to its source of data. At a minimum, infeed and outfeed counts and asset state should be connected. If not all counts are available, a single count, infeed or outfeed, can be connected and the missing counts will be calculated automatically. To determine OEE Quality, at least two counts are required. The Inputs tags are reference tags and support MQTT backflushing in the event of a network drop.
If operations are started through the MES Application (Operator screen) or by the schedule, state and counts are all you need to connect. If the asset is operated from a different HMI or SCADA, also connect the Mode, Work Order and Product Code tags to the source, to fully capture production information within the MES.
| Tag | Connect it to | What Kanoa does when it changes |
|---|---|---|
| Infeed Count | Your infeed count source. If an infeed count isn't available, it's derived as outfeed × package count + waste | Records the change as a counter event on the asset's infeed counter. Counts can be running totals: if the value drops (a PLC reset), the new value is counted as the change |
| Outfeed Count | Your outfeed count source. If an outfeed count isn't available, it's derived as (infeed - waste) ÷ package count | Records a counter event on the outfeed counter, the same way |
| Waste Count | Your waste count source. If a waste count isn't available, it's derived as infeed - outfeed × package count | Records a counter event on the waste counter, the same way |
| State | The asset's state code | Records a state event. If the new and previous states are both downtime and nobody has coded the previous one yet, it updates that event instead of adding another, so an operator can code a stop before restarting. Bad quality records the asset's Off Line state |
| Machine ID | The cell that caused the state, for a line with cells | State is looked up against this cell's states. For example, on 'Packaging Line 1' with cells 'Filler', 'Capper' and 'Palletizer', set Machine ID to the Filler's assetId (7) and State to the code linking the Filler to 'CIP' (127). Leave blank to use the line's own states |
| Part Required | A signal that a part is needed | Flags the downtime event as needing a part, stored with the state event. The Loss Analysis screen doesn't use it |
| Mode | The asset's mode, if it can be read from a tag | Starts a mode change for the asset, with the current work order and product |
| Work Order | The production order running, if it can be read from a tag | Starts a mode change for the asset with the new work order |
| Product Code | The product running, if it can be read from a tag | Starts a production run of that item, or goes Idle when blank. The order and item are created if they don't exist |
| Tooling | Not used by Kanoa tooling | Kept for existing configurations. To mount tools from the PLC, use the machine's Tooling/Inputs/Tooling tag instead (see Tooling Tags) |
Cells That Don't Make the Item
Some cells work on an item without making it: an end-of-line tester, an inspection station, a leak test. Their OEE is worth tracking, but the units they process were already counted by the cell that made them.
Kanoa's produced quantities come from outfeed counts. An order's actual quantity (woActualQty) and the production totals for an item add up the outfeed counted on every asset that runs it. If a test cell also counts outfeed, each unit it tests is counted again.
To track the cell's OEE without adding to the produced quantity, connect only its infeed and waste:
| Input | Connect it to |
|---|---|
| Infeed Count | Every unit the cell finishes, passed or failed. If the PLC has pass and fail counts but no total, use an expression tag that adds them |
| Waste Count | The units that failed |
| Outfeed Count | Nothing. Leave it unconnected |
| State | The cell's state code, as for any asset |
The cell's OEE is still complete:
- Performance compares the infeed with the item's standard rate on the cell, so set that rate to the cell's ideal test rate (for example, 1 unit per 45 minutes).
- Quality is (infeed − waste) ÷ infeed, the cell's pass rate.
- Availability comes from its states, as usual.
The cell can run the order and item in a Production mode like the other assets, so its time and OEE are still recorded against them. Its screens and OEE tags show an outfeed worked out as infeed − waste, but that isn't a recorded count, so it isn't added to the order's or item's produced quantity.
Two things to be aware of when you report on several assets together, for example an item's OEE across a line:
- Infeed and waste are added up from every asset, the test cell included. The combined infeed is the units made plus the units tested, and the combined quality includes the test cell's failures.
- If the item ran only on cells with no outfeed in the report's date range, there's no recorded outfeed to add up, so the report works one out from the combined infeed − waste: the units that passed the test. When the cell that makes the item ran in the same range, its recorded outfeed is used instead.
OEE Folder
The OEE folder is deprecated: the asset's OEE tags in the kanoaMES tag provider replace it. Kanoa still writes it every minute, so existing screens and scripts keep working, but it gets nothing new: current shift values, counts that update as they're recorded, counts by item and speed loss are only in the kanoaMES tags. Use them for new screens and scripts, and move existing ones when you next change them. The other folders on this page aren't affected.
The OEE folder holds live values Kanoa writes for the asset's current run: the mode, order and item, counts, times, availability, performance and quality, the current state and shift. It's a primary source for dashboards and live operator visualization. Treat it as read-only.
How it's filled. Most tags come from the asset's current mode event, through system.kanoa.event.getAssetProductionEvents({'activeModeOnly': True}). The gateway writes them every minute, and setting OEE/refresh to true writes them for this asset straight away. The state tags change with the Inputs/State tag, the shift tags come from updateAssetShiftTimer every minute, and the schedule tags are written when the schedule starts or ends a run.
The same values, split into the current run and the current shift, with counts that update as they're recorded, speed loss and counts by item, are in the asset's kanoaMES OEE tags.
Totals for the current run. Times, counts and the OEE factors cover the period from when the current mode started (startDate) until now, not the shift or the day. They reset when the mode changes. In any mode other than Production they are blank, apart from durationSecs.
Run and Timing
| Tag | Description |
|---|---|
| startDate | When the asset's current mode started |
| endDate | Not written by Kanoa. The current mode has no end yet, so it stays blank |
| durationSecs | Seconds from startDate until now, including downtime |
| runtimeSecs | Seconds the asset spent in a Running state since startDate |
| unplannedDowntimeSecs | Seconds the asset spent in an Unplanned Downtime state since startDate |
| plannedDowntimeSecs | Seconds the asset spent in a Planned Downtime state since startDate |
Counts
| Tag | Description |
|---|---|
| infeedCount | Total of the asset's infeed counters since startDate. With no infeed counts it's derived as outfeedCount × packageCount + wasteCount |
| outfeedCount | Total of the asset's outfeed counters since startDate. With no outfeed counts it's derived as (infeedCount − wasteCount) ÷ packageCount |
| wasteCount | Total of the asset's waste counters since startDate. With no waste counts it's derived as infeedCount − outfeedCount × packageCount, or 0 when only one count is connected |
| targetCount | How many the asset should have made in its Running time at the standard rate: runtimeSecs × standardRate, per hour or per minute depending on period |
| packageCount | How many infeed units make one outfeed unit, from the item's production rate on this asset (1 when not set) |
| infeedUnits, outfeedUnits, wasteUnits | The units each count is in, from the item's production rate on this asset |
OEE Factors and Rates
| Tag | Description |
|---|---|
| availability | Running time as a share of the time the asset should have been running: runtimeSecs ÷ (runtimeSecs + unplannedDowntimeSecs). Planned downtime isn't counted against it |
| performance | Actual output against the standard rate during Running time: infeedCount ÷ (standardRate × Running time in the rate's period). For a Batch (in mins) rate it's standardRate × 60 ÷ runtimeSecs. 0 when there's no infeed, no Running time or no standard rate |
| quality | Share of the infeed that wasn't waste: (infeedCount − wasteCount) ÷ infeedCount. 1 when there's no infeed yet |
| standardRate | The rate performance is measured against: the rate set on the run if one was given, otherwise the rate the run was stamped with when it started. With a tool mounted that's the item's rate for the tool, or the tool's cycle rate × parts per cycle (see Cycle Rates and Item Rates); otherwise the item's standard rate on this asset |
| period | What standardRate is per: Minute, Hour or Batch (in mins) |
| infeedRateSecs | The average infeed count per second of Running time since startDate. It isn't an instantaneous rate, and downtime doesn't count towards the time |
| outfeedRatePerMinute | The average outfeed count per minute since startDate: outfeedCount ÷ (durationSecs ÷ 60). Unlike infeedRateSecs, downtime does count towards the time |
Mode
| Tag | Description |
|---|---|
| modeId, modeName | The asset's current mode, for example Production or Idle. When Enable Quality is on, a change of modeId triggers Kanoa Quality's mode-change checks |
| modeTypeName | The current mode's type |
| modeColor, iconPath | The current mode's color and icon, for screens |
| modeSourceName | What started the current mode: PLC, Operator, Operator Run or Schedule |
| userName | The user who started the current mode |
Order and Item
| Tag | Description |
|---|---|
| workOrderId, workOrderName | The production order running, if any |
| workOrderTitle | The order's title, or its name when it has no title |
| reqdQty | The order's required quantity |
| woActualQty | Outfeed counted against the order so far, across its production runs in the last month, including counts recorded against the order on other runs |
| woRemainingMinutes | Estimated minutes to finish the order at the current pace: (reqdQty − woActualQty) ÷ outfeedRatePerMinute. Blank when there's no order, required quantity, actual quantity or outfeed rate yet |
| itemId, itemName, itemDescription | The item running. When Enable Quality is on, a change of itemId triggers Kanoa Quality's product-change checks |
State
Written by the Inputs/State tag each time the state changes.
| Tag | Description |
|---|---|
| stateName | The current state's name, or the state code itself when that code isn't configured for the asset |
| stateTypeName | The current state's type: Running, Unplanned Downtime or Planned Downtime |
| stateColor | The state's color, or its state type's color when the state has none |
| stateTypeColor | The state type's color |
| stateIconPath | The state's icon |
Shift
Written by the updateAssetShiftTimer timer every minute.
| Tag | Description |
|---|---|
| shiftId, shiftName | The shift the asset is in now |
| shiftNameId | The shift name's id. When Enable Quality is on, a change triggers Kanoa Quality's shift-change checks |
| shiftStart, shiftEnd | When the current shift started and when it ends |
Schedule
Written by the checkAssetScheduleTimer timer when the schedule starts a run on the asset, and cleared when the schedule ends it. Blank when the current run wasn't started by the schedule.
| Tag | Description |
|---|---|
| scheduleBlockId | The schedule block that started the current run |
| scheduleStart, scheduleEnd | The scheduled start and end of that block |
Speed Loss
Written by the speed-loss check every minute (see Speed Loss).
| Tag | Description |
|---|---|
| belowStandard | true while an automatic speed-loss event is open: the asset has been running below its standard rate |
| actualRate | The actual rate over the last few minutes of running, in the run's period |
| actualRatePct | The actual rate as a percentage of the standard rate |
| performanceEventId | The open speed-loss event, or empty |
| performanceReason | Its reason: Unassigned, Positions blocked, or the reason an operator set |
| performanceReasonColor | Its reason's colour |
Refresh
| Tag | Description |
|---|---|
| refresh | Set to true to write this asset's mode, order, item, count and OEE values now instead of waiting for the next timer run. It resets itself |
OEE Thresholds Folder
The OEE Thresholds folder stores the asset's OEE targets and tolerances (a, p, q, oee and their tolerances), used by dashboards and visual indicators. They are configured in Kanoa and loaded into the tags; set oeeThresholds/update to true to reload them. Treat them as read-only.
Check Your Understanding
- Which assets should be OEE Enabled?
- You need a second line just like Machine 1. What's the quickest way to set it up?
- Why is it safe to rename or move an asset that has been running for a year?
Answers
- The equipment that runs production, usually a line or a cell. The enterprise, site and areas only organize the tree.
- Duplicate Machine 1. The copy has its whole setup, including its mode, state and item links.
- Kanoa stores the asset's history against its ID, which never changes.